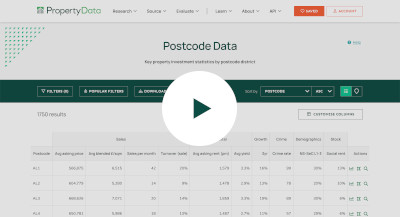
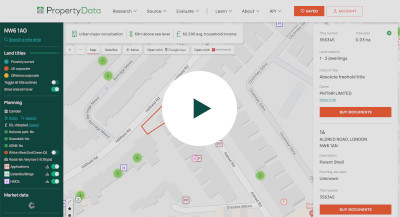
Postcode Data
Find out how to use Postcode Data to shortlist areas


Get the insights you need to find your next property investment opportunity.
Try PropertyData for free for 14-days with no commitment. Monthly rolling subscription after trial, cancel at any time.
Sign-up for freeHow PropertyData can help you

Be a smarter property investor using data
Some of the ways property investors use PropertyData to boost their returns
I'm an investor
Make data-driven development decisions
How property developers can use market research in decision-making
I'm a developer
Save time and impress your clients with data
How agents can use PropertyData to gain an edge on the competition
I'm an agent

Limit reached
Sorry, you've reached your monthly search limit.
Upgrade your account or purchase additional credits for more searches.
Upgrade Purchase creditsUpgrade to download PDFs
There are many places in PropertyData to export data as well-formatted PDF files, including Local Data, Plot Map, Valuations, property reports and more.
| Download PDFs | Branded PDFs | |
| Basic | ||
| Standard | ||
| Pro | ||
| Unlimited |
Transparent data promise
Where does the raw data come from?
Property listings seen on rightmove.co.uk, zoopla.co.uk and onthemarket.com.
How often is the data updated?
The data is updated in near real-time.
What time period does the data cover?
This is a real-time market snapshot - the data covers currently listed properties. Once properties are removed from the portal, they are soon removed from this tab.
How is the raw data processed?
Duplicates from multiple sources are matched and reconciled as far as possible. Listings with obvious errors, where price or number or bedrooms appear out of range, are discarded.
What are the statistics used?
Averages shown are the interquartile mean, a type of average that is insensitive to outliers while being its own distinct parameter. The 80% range means that 80% of the listed properties fall inside this range.
Where does the raw data come from?
Property listings seen on rightmove.co.uk, zoopla.co.uk and onthemarket.com.
How do you know the square footage of properties?
We use proprietary technology to read the square footage of properties from agent floorplans. Although we cannot determine the square footage for all properties, we can usually get sufficient coverage. Agents are sometimes known to inflate square footage, and this should be borne in mind as a weakness of this data.
How often is the data updated?
The data is updated in near real-time.
What time period does the data cover?
This is a real-time market snapshot - the data covers currently listed properties. Once properties are removed from the portal, they are soon removed from this tab.
How is the raw data processed?
Duplicates from multiple sources are matched and reconciled as far as possible. Listings with obvious errors, where price or number or bedrooms appear out of range, are discarded.
What are the statistics used?
The average shown is the interquartile mean, a type of average that is insensitive to outliers while being its own distinct parameter. The 80% range means that 80% of the listed properties fall inside this range.
Where does the raw data come from?
Property "price paid" data provided by the Land Registry.
How often is the data updated?
Once per month when released by the Land Registry, typically towards the end of each calendar month covering up to the end of the previous calendar month.
What time period does the data cover?
You can customise the time period using the filter at the top of the view. The default time period is up to 9 months back from today's date. The latest data covers the period up to 2024-03-01, although some sales that took place before this date may still be added in the coming months.
How is the raw data processed?
No additional processes are applied to this data.
What are the statistics used?
Averages shown are the interquartile mean, a type of average that is insensitive to outliers while being its own distinct parameter. The 80% range means that 80% of the listed properties fall inside this range.
Where does the raw data come from?
Property "price paid" data provided by the Land Registry, and Energy Performance Certificate (EPC) data provided by Department for Levelling Up, Housing & Communities.
How do you know the square footage of properties?
We match the Land Registry data to EPC data provided by the Department for Levelling Up, Housing & Communities. Due to the fact that not all properties sold have had an EPC and vagaries of addressing in the UK, we are not able to determine the square footage of all properties, but we can usually get sufficient coverage.
How often is the data updated?
The private paid data is updated once per month when released by the Land Registry, typically towards the end of each calendar month covering up to the end of the previous calendar month. The energy performance certificate database is updated monthly.
What time period does the data cover?
You can customise the time period using the filter at the top of the view. The default time period is up to 9 months back from today's date. The latest data covers the period up to 2024-03-01, although some sales that took place before this date may still be added in the coming months.
How is the raw data processed?
No additional processes are applied to this data.
What are the statistics used?
The average shown is the interquartile mean, a type of average that is insensitive to outliers while being its own distinct parameter. The 80% range means that 80% of the listed properties fall inside this range.
Where does the raw data come from?
Property listings seen on rightmove.co.uk, zoopla.co.uk and onthemarket.com.
How often is the data updated?
The data is updated in near real-time.
What time period does the data cover?
This is a real-time market snapshot - the data covers currently listed properties. Once properties are removed from the portal, they are soon removed from this tab.
How is the raw data processed?
Duplicates from multiple sources are matched and reconciled as far as possible. Listings with obvious errors, where price or number or bedrooms appear out of range, are discarded.
What are the statistics used?
The average shown is the interquartile mean, a type of average that is insensitive to outliers while being its own distinct parameter. The 80% range means that 80% of the listed properties fall inside this range.
Where does the raw data come from?
Room let listings on SpareRoom, the UK's biggest room letting website.
How often is the data updated?
The data is updated in near real-time.
What time period does the data cover?
This is a real-time market snapshot - the data covers currently listed properties. Once properties are removed from SpareRoom, they are soon removed from this tab.
How is the raw data processed?
Listings with obvious errors, where price or number or bedrooms appear out of range, are discarded.
What are the statistics used?
The average shown is the interquartile mean, a type of average that is insensitive to outliers while being its own distinct parameter. The 80% range means that 80% of the listed properties fall inside this range.
Where does the raw data come from?
Property listings seen on rightmove.co.uk, zoopla.co.uk and onthemarket.com.
How often is the data updated?
The data is updated in near real-time.
What time period does the data cover?
This is a real-time market snapshot - the data covers currently listed properties. Once properties are removed from the portal, they are soon removed from this tab.
How is the raw data processed?
Duplicates from multiple sources are matched and reconciled as far as possible. Listings with obvious errors, where price or number or bedrooms appear out of range, are discarded. Yields are calculated by comparing only properties with the same number of bedrooms, e.g. 3-bedroom properties for rent with 3-bedroom properties for sale.
What is the yield calculation used?
The calculation used is (average_weekly_asking_rent * 52 / average_asking_price), expressed as a percentage. It is a top-line gross yield, meaning no expenses are considered.
What are the statistics used?
The average shown is the interquartile mean, a type of average that is insensitive to outliers while being its own distinct parameter. The 80% range means that 80% of the listed properties fall inside this range.
Where does the raw data come from?
Property listings seen on rightmove.co.uk, zoopla.co.uk and onthemarket.com.
How often is the data updated?
The data is updated in near real-time.
What time period does the data cover?
This is a real-time market snapshot - the data covers currently listed properties. Once properties are removed from Zoopla, Rightmove or Spareroom, they are soon removed from this tab.
How is the raw data processed?
Duplicates from multiple sources are matched and reconciled as far as possible. Yields are calculated by comparing only properties with the same number of bedrooms, e.g. 3-bedroom properties for rent with 3-bedroom properties for sale. For the SpareRoom data, hypothetical properties consisting of two to six average double rooms with shared bathrooms are used to derived average rent. For all sources, listings with obvious errors, where price or number or bedrooms appear out of range, are discarded.
What is the yield calculation used?
The calculation used is (average_weekly_asking_rent * 52 / average_asking_price), expressed as a percentage. It is a top-line gross yield, meaning no expenses are considered.
What are the statistics used?
The average shown is the interquartile mean, a type of average that is insensitive to outliers while being its own distinct parameter. The 80% range means that 80% of the listed properties fall inside this range.
Where does the raw data come from?
Property "price paid" data provided by the Land Registry.
How often is the data updated?
Once per month when released by the Land Registry, typically towards the end of each calendar month covering up to the end of the previous calendar month.
Zoopla Zed-index
What time period does the data cover?
The data covers transactions in the last six years
How is the raw data processed?
No additional processes are applied to this data.
What are the statistics used?
The average shown is the interquartile mean, a type of average that is insensitive to outliers while being its own distinct parameter. The 80% range means that 80% of the listed properties fall inside this range.
Where does the raw data come from?
Property listings seen on rightmove.co.uk, zoopla.co.uk and onthemarket.com.
How often is the data updated?
The listings data is updated in near real-time. The Land Registry data is updated once per month when released, typically towards the end of each calendar month covering up to the end of the previous calendar month.
What time period does the data cover?
The price paid data shown goes back to January 2015. The listings data is a real-time market snapshot - the data covers currently listed properties. Once properties are removed from the portal, they are soon removed from this tab.
How is the raw data processed?
Duplicates from multiple sources are matched and reconciled as far as possible. Listings with obvious errors, where price or number or bedrooms appear out of range, are discarded.
What are the calculations used?
Average sales per month are for the last 3 finalised months. Turnover is average sales per month divided by total for sale. Inventory is 100 divided by turnover.
Where does the raw data come from?
Property listings seen on rightmove.co.uk, zoopla.co.uk and onthemarket.com.
How often is the data updated?
The listings data is updated in near real-time. The Land Registry data is updated once per month when released, typically towards the end of each calendar month covering up to the end of the previous calendar month.
What time period does the data cover?
This is a real-time market snapshot - the data covers currently listed properties. Once properties are removed from the portal, they are soon removed from this tab.
How is the raw data processed?
Duplicates from multiple sources are matched and reconciled as far as possible. Listings with obvious errors, where price or number or bedrooms appear out of range, are discarded.
Where does the raw data come from?
We receive data on the extent and corporate ownership of all land titles in England & Wales from the Land Registry.
How often is the data updated?
The data is updated once per month when released, typically in the first few days of each calendar month.
What time period does the data cover?
This is an ownership snapshot - the data represents ownership as recorded by the Land Registry at the last monthly export.
How is the raw data processed?
No additional processes are applied to this data.
Where does the raw data come from?
We source different expert forecasts Savills, Knight Frank, OBR
How often is the data updated?
The data is updated annually when new forecasts are released, typically towards the beginning of the year.
How is the raw data processed?
We calculate a consensus forecast using a simple mean average.