Is a housing crash in the UK inevitable?

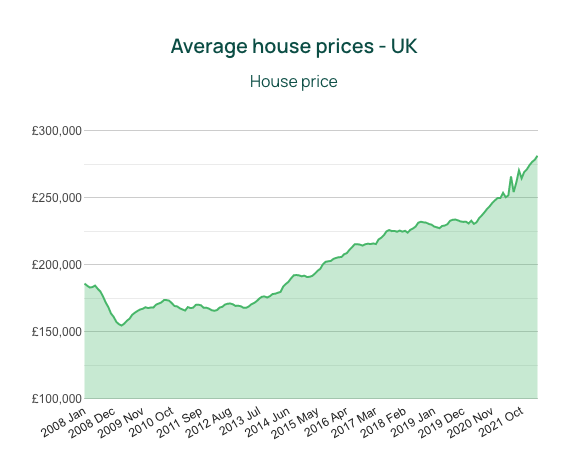
While the UK property market has been in rude health in recent years, there are growing concerns in some quarters that a housing market crash could be just around the corner. Since the coronavirus pandemic, house prices in the United Kingdom have increased by over £55,000 on average.

Of course, the property market enjoyed something of a kickstart during the pandemic, as government measures like the temporary scrapping of stamp duty helped to drive sales during an economic downturn. Now that the stamp duty holiday is over, some investors are expecting the market will witness a slump in prices in the near future.

Is the housing market overheated?

Some economists consider the UK housing market to currently be overheated. This is due in part to the lack of new builds required to house a population that continues to grow year on year. As a result, many would-be first-time buyers are finding it impossible to make it onto the first rung of the property ladder.

While first-time buyers can’t quite get a foothold on the property ladder, existing homeowners and buy-to-let investors are continuing to make purchases, leaving millennials as “generation rent”. However, recent statistics have shown that it’s not just young professionals finding themselves renting. Increasing numbers of people over the age of 60 are renting, with the number of people of pensionable age in rented accommodation having doubled over the past twelve years.

When will house prices fall?

There is speculation that, after a particularly strong start to the year, the housing affordability crunch will begin to have an impact on market behaviour towards the end of 2022. Interest rate rises are expected during this period, coupled with greater market choice as increasing numbers of properties make their way onto the market. This potentially means investors might expect minor month-on-month price dips during the final quarter of the year. However, it is worth noting that all investment is speculative, and housing market crash predictions are exactly that - mere predictions, of which time will tell whether they were accurate or not.

Some investors and economists are speculating that house prices will fall in the last quarter of 2022, albeit by less than they have appreciated in value over the past twelve months. Squeezed incomes and rising mortgage rates are expected to play a role.

Is there a housing bubble in the UK?

Property prices in the UK have hit record-breaking prices over the past two years, and even the soaring cost of living hasn’t dampened our appetite for property investment. Housing market predictions can be tricky, and while some might consider the current situation as a housing bubble ready to pop, it’s worth noting that in times of recession, house prices tend to fall. It’s only natural. This has nothing to do with a bubble, and everything to do with the circumstances we find ourselves in whenever a recession occurs.

Recession brings with it a higher risk of unemployment, coupled with a higher cost of living. This means that prospective first-time buyers find themselves inevitably being unable to purchase a home, or even begin planning to.

However, buy-to-let investors can always gain from such circumstances, provided they have the capital to make a purchase. While recession tends to create market uncertainty (which means traditional lenders like banks are more reluctant to fund mortgages), buy-to-let investors can always use existing property as capital to fund further investment, at a time when house prices are low.

Is the UK housing market going to crash?

While the cost of living crisis and high inflation might deter would-be investors from purchasing property, there is still no clear evidence of an inevitable housing market crash in the UK. With UK house prices forecast to dip towards the end of the year, a slight slump does not in itself constitute a “crash” in the sense we experienced in 2008.

For context, the 2008 recession is considered to have occurred after too many mortgages were issued to individuals who were unable to keep up with the payments - not just in the UK, but by major international banks, which in turn had a knock-on effect on the world economy. Many banks closed down overnight, with others having to be bailed out.

This resulted in the average house price falling by around 15% over a twelve-month period. Many homeowners found themselves in negative equity - where the price paid for a property is less than it is worth.

By comparison, some economists speculate that house prices could fall by around 5% by 2023. This is after a 12% surge in property prices over the past twelve months, which would indicate that if a fall in house prices does happen, it will hopefully be nowhere near the crisis levels of 2008.

Will UK house prices drop in 2022?

Speculation suggests that there could potentially be a housing market crash in 2022. A rise in the prices of fuel, energy and food has hit households hard, with many struggling to keep up with day-to-day living costs, or alternatively having to adjust their budgets accordingly.

The Bank of England has predicted that inflation could reach 10% by the end of 2022. By May of this year, inflation had already reached 9%, which means that predictions appear to be on track - but what exactly does this mean for the UK housing market?

In all honesty, it can be difficult to say. There is no hard and fast rule of prediction when it comes to property prices and a potential housing market crash - merely speculation. History doesn’t tend to repeat itself as far as the markets are concerned, and tangible assets like housing are traditionally favoured by investors during times of economic hardship. This ultimately means that property prices tend to maintain stability.

Despite inflation and a rise in the cost of living, house prices have continued to rise with consistency. In fact, the United Kingdom has recently enjoyed its longest continuous house price increase for six years. This is in part due to low mortgage rates, although there are concerns that inflation will increase such mortgage rates, which could deter some - but not all - property investors.

At a glance: what could cause house prices to fall this year

While it is unlikely that house prices will crash in the sense that new homeowners will be left in negative equity, there is a possibility that they could fall slightly. While it’s true that house prices have increased by over £55,000 on average in the past two years alone, the following circumstances could cause a slight fall in property prices between now and the end of the year:

  • Cost of living crisis: As inflation rises, goods and services are becoming marginally more expensive compared to just one year ago. With more of us feeling overstretched, many would-be investors might feel like now is simply not the right time to buy.
  • Rising energy/fuel costs: Those struggling to meet fuel costs in order to go about their daily business might consider downsizing or selling up to make ends meet. This means the housing supply will increase, and the law of supply-and-demand suggests this could cause property prices to fall slightly.
  • Market correction: Property prices rose extremely quickly during the pandemic, and some economists predict a “correction” could be on the cards, whereby the prices will fall just as quickly as they increased.
  • Rising interest rates: Interest rates have soared from record lows, which could make mortgages more expensive. Increased mortgage rates could reduce demand.
  • General uncertainty: Despite most of the economy opening back up, there is still uncertainty as to whether the Covid-19 pandemic is over, or whether new variants could create the need for further restrictions in the wintertime. In addition to this, political uncertainty in Eastern Europe could also cause some investors to be apprehensive.

Ultimately, it depends on the economists you listen to - some are predicting a small yet not inconsiderable fall in property prices, while others think the UK property market will weather the storm.

UK house prices forecast: find out more about housing market predictions

If you’d like to keep up to date with UK property prices by postcode, or if you would like access to a wealth of data which could be used to make more informed property investment decisions, why not sign up to PropertyData today?

You can take advantage of a two-week free trial and have access to tools, resources and calculators which could help you decide whether an investment could be worthwhile.

Sign up to PropertyData for free

How PropertyData can help you

PropertyData investor illustration

Be a smarter property investor using data

Some of the ways property investors use PropertyData to boost their returns

I'm an investor
PropertyData data illustration

Make data-driven development decisions

How property developers can use market research in decision-making

I'm a developer
PropertyData clients illustration

Save time and impress your clients with data

How agents can use PropertyData to gain an edge on the competition

I'm an agent

Limit reached

Sorry, you've reached your monthly search limit.

Upgrade your account or purchase additional credits for more searches.

Upgrade Purchase credits

Upgrade to download PDFs

There are many places in PropertyData to export data as well-formatted PDF files, including Local Data, Plot Map, Valuations, property reports and more.

  Download PDFs Branded PDFs
Basic
Standard
Pro
Unlimited
Start your free trial now

Transparent data promise

Where does the raw data come from?

Property listings seen on rightmove.co.uk, zoopla.co.uk and onthemarket.com.

How often is the data updated?

The data is updated in near real-time.

What time period does the data cover?

This is a real-time market snapshot - the data covers currently listed properties. Once properties are removed from the portal, they are soon removed from this tab.

How is the raw data processed?

Duplicates from multiple sources are matched and reconciled as far as possible. Listings with obvious errors, where price or number or bedrooms appear out of range, are discarded.

What are the statistics used?

Averages shown are the interquartile mean, a type of average that is insensitive to outliers while being its own distinct parameter. The 80% range means that 80% of the listed properties fall inside this range.

Where does the raw data come from?

Property listings seen on rightmove.co.uk, zoopla.co.uk and onthemarket.com.

How do you know the square footage of properties?

We use proprietary technology to read the square footage of properties from agent floorplans. Although we cannot determine the square footage for all properties, we can usually get sufficient coverage. Agents are sometimes known to inflate square footage, and this should be borne in mind as a weakness of this data.

How often is the data updated?

The data is updated in near real-time.

What time period does the data cover?

This is a real-time market snapshot - the data covers currently listed properties. Once properties are removed from the portal, they are soon removed from this tab.

How is the raw data processed?

Duplicates from multiple sources are matched and reconciled as far as possible. Listings with obvious errors, where price or number or bedrooms appear out of range, are discarded.

What are the statistics used?

The average shown is the interquartile mean, a type of average that is insensitive to outliers while being its own distinct parameter. The 80% range means that 80% of the listed properties fall inside this range.

Where does the raw data come from?

Property "price paid" data provided by the Land Registry.

How often is the data updated?

Once per month when released by the Land Registry, typically towards the end of each calendar month covering up to the end of the previous calendar month.

What time period does the data cover?

You can customise the time period using the filter at the top of the view. The default time period is up to 9 months back from today's date. The latest data covers the period up to 2024-02-29, although some sales that took place before this date may still be added in the coming months.

How is the raw data processed?

No additional processes are applied to this data.

What are the statistics used?

Averages shown are the interquartile mean, a type of average that is insensitive to outliers while being its own distinct parameter. The 80% range means that 80% of the listed properties fall inside this range.

Where does the raw data come from?

Property "price paid" data provided by the Land Registry, and Energy Performance Certificate (EPC) data provided by Department for Levelling Up, Housing & Communities.

How do you know the square footage of properties?

We match the Land Registry data to EPC data provided by the Department for Levelling Up, Housing & Communities. Due to the fact that not all properties sold have had an EPC and vagaries of addressing in the UK, we are not able to determine the square footage of all properties, but we can usually get sufficient coverage.

How often is the data updated?

The private paid data is updated once per month when released by the Land Registry, typically towards the end of each calendar month covering up to the end of the previous calendar month. The energy performance certificate database is updated monthly.

What time period does the data cover?

You can customise the time period using the filter at the top of the view. The default time period is up to 9 months back from today's date. The latest data covers the period up to 2024-02-29, although some sales that took place before this date may still be added in the coming months.

How is the raw data processed?

No additional processes are applied to this data.

What are the statistics used?

The average shown is the interquartile mean, a type of average that is insensitive to outliers while being its own distinct parameter. The 80% range means that 80% of the listed properties fall inside this range.

Where does the raw data come from?

Property listings seen on rightmove.co.uk, zoopla.co.uk and onthemarket.com.

How often is the data updated?

The data is updated in near real-time.

What time period does the data cover?

This is a real-time market snapshot - the data covers currently listed properties. Once properties are removed from the portal, they are soon removed from this tab.

How is the raw data processed?

Duplicates from multiple sources are matched and reconciled as far as possible. Listings with obvious errors, where price or number or bedrooms appear out of range, are discarded.

What are the statistics used?

The average shown is the interquartile mean, a type of average that is insensitive to outliers while being its own distinct parameter. The 80% range means that 80% of the listed properties fall inside this range.

Where does the raw data come from?

Room let listings on SpareRoom, the UK's biggest room letting website.

How often is the data updated?

The data is updated in near real-time.

What time period does the data cover?

This is a real-time market snapshot - the data covers currently listed properties. Once properties are removed from SpareRoom, they are soon removed from this tab.

How is the raw data processed?

Listings with obvious errors, where price or number or bedrooms appear out of range, are discarded.

What are the statistics used?

The average shown is the interquartile mean, a type of average that is insensitive to outliers while being its own distinct parameter. The 80% range means that 80% of the listed properties fall inside this range.

Where does the raw data come from?

Property listings seen on rightmove.co.uk, zoopla.co.uk and onthemarket.com.

How often is the data updated?

The data is updated in near real-time.

What time period does the data cover?

This is a real-time market snapshot - the data covers currently listed properties. Once properties are removed from the portal, they are soon removed from this tab.

How is the raw data processed?

Duplicates from multiple sources are matched and reconciled as far as possible. Listings with obvious errors, where price or number or bedrooms appear out of range, are discarded. Yields are calculated by comparing only properties with the same number of bedrooms, e.g. 3-bedroom properties for rent with 3-bedroom properties for sale.

What is the yield calculation used?

The calculation used is (average_weekly_asking_rent * 52 / average_asking_price), expressed as a percentage. It is a top-line gross yield, meaning no expenses are considered.

What are the statistics used?

The average shown is the interquartile mean, a type of average that is insensitive to outliers while being its own distinct parameter. The 80% range means that 80% of the listed properties fall inside this range.

Where does the raw data come from?

Property listings seen on rightmove.co.uk, zoopla.co.uk and onthemarket.com.

How often is the data updated?

The data is updated in near real-time.

What time period does the data cover?

This is a real-time market snapshot - the data covers currently listed properties. Once properties are removed from Zoopla, Rightmove or Spareroom, they are soon removed from this tab.

How is the raw data processed?

Duplicates from multiple sources are matched and reconciled as far as possible. Yields are calculated by comparing only properties with the same number of bedrooms, e.g. 3-bedroom properties for rent with 3-bedroom properties for sale. For the SpareRoom data, hypothetical properties consisting of two to six average double rooms with shared bathrooms are used to derived average rent. For all sources, listings with obvious errors, where price or number or bedrooms appear out of range, are discarded.

What is the yield calculation used?

The calculation used is (average_weekly_asking_rent * 52 / average_asking_price), expressed as a percentage. It is a top-line gross yield, meaning no expenses are considered.

What are the statistics used?

The average shown is the interquartile mean, a type of average that is insensitive to outliers while being its own distinct parameter. The 80% range means that 80% of the listed properties fall inside this range.

Where does the raw data come from?

Property "price paid" data provided by the Land Registry.

How often is the data updated?

Once per month when released by the Land Registry, typically towards the end of each calendar month covering up to the end of the previous calendar month.

Zoopla Zed-index

What time period does the data cover?

The data covers transactions in the last six years

How is the raw data processed?

No additional processes are applied to this data.

What are the statistics used?

The average shown is the interquartile mean, a type of average that is insensitive to outliers while being its own distinct parameter. The 80% range means that 80% of the listed properties fall inside this range.

Where does the raw data come from?

Property listings seen on rightmove.co.uk, zoopla.co.uk and onthemarket.com.

How often is the data updated?

The listings data is updated in near real-time. The Land Registry data is updated once per month when released, typically towards the end of each calendar month covering up to the end of the previous calendar month.

What time period does the data cover?

The price paid data shown goes back to January 2015. The listings data is a real-time market snapshot - the data covers currently listed properties. Once properties are removed from the portal, they are soon removed from this tab.

How is the raw data processed?

Duplicates from multiple sources are matched and reconciled as far as possible. Listings with obvious errors, where price or number or bedrooms appear out of range, are discarded.

What are the calculations used?

Average sales per month are for the last 3 finalised months. Turnover is average sales per month divided by total for sale. Inventory is 100 divided by turnover.

Where does the raw data come from?

Property listings seen on rightmove.co.uk, zoopla.co.uk and onthemarket.com.

How often is the data updated?

The listings data is updated in near real-time. The Land Registry data is updated once per month when released, typically towards the end of each calendar month covering up to the end of the previous calendar month.

What time period does the data cover?

This is a real-time market snapshot - the data covers currently listed properties. Once properties are removed from the portal, they are soon removed from this tab.

How is the raw data processed?

Duplicates from multiple sources are matched and reconciled as far as possible. Listings with obvious errors, where price or number or bedrooms appear out of range, are discarded.

Where does the raw data come from?

We receive data on the extent and corporate ownership of all land titles in England & Wales from the Land Registry.

How often is the data updated?

The data is updated once per month when released, typically in the first few days of each calendar month.

What time period does the data cover?

This is an ownership snapshot - the data represents ownership as recorded by the Land Registry at the last monthly export.

How is the raw data processed?

No additional processes are applied to this data.

Where does the raw data come from?

We source different expert forecasts Savills, Knight Frank, OBR

How often is the data updated?

The data is updated annually when new forecasts are released, typically towards the beginning of the year.

How is the raw data processed?

We calculate a consensus forecast using a simple mean average.