PropertyData is the quickest way to compare properties in a given area. View clean, simple property reports to help determine whether a property you are looking at is correctly priced for sale or rent.
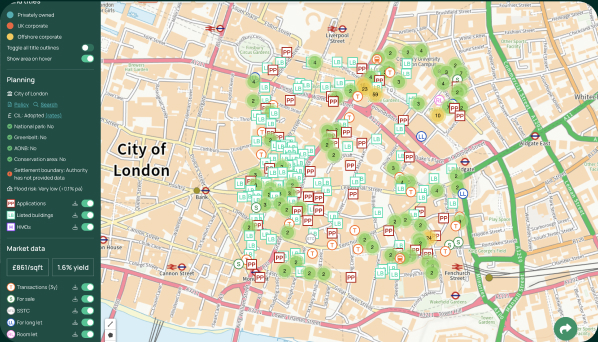
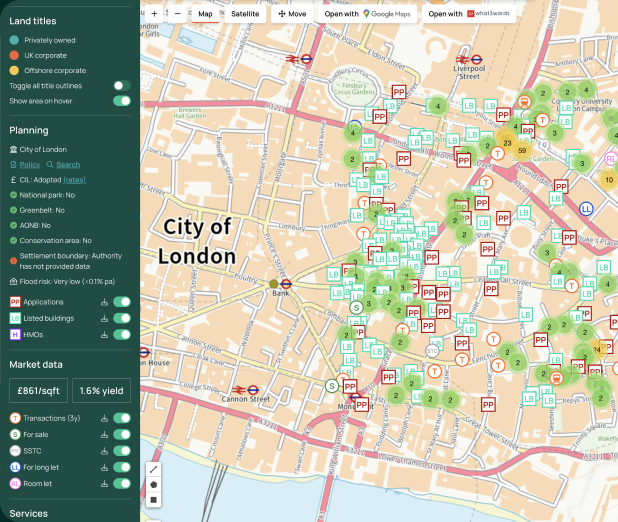
Plot Map
Beautiful high resolution maps of buildings and boundaries overlaid with market data, planning applications, listed buildings & more
View Plot Map
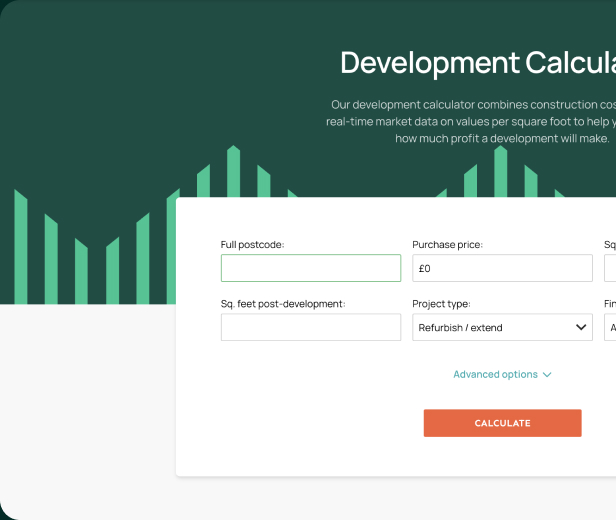
Development calculator
Combines construction cost and £/sqft market data to find development profit
Calculate nowDeal Analyser
Appraise any property for buy-to-let or BRRR in seconds, with an auto-filled value, rent and refurb budget and one clear verdict
Analyse a dealFinance finder
Compare investor mortgages for individuals and limited companies, as well as bridging and development finance
Learn moreCouncil tax lookup
Find the council tax band and estimated bill of a property, by postcode
Learn moreStamp duty calculator
Our up-to-date stamp duty calculator works in all 4 nations of the UK, and for every type of property transaction
Learn moreMortgage interest calculator
Calculate monthly repayments, total mortgage cost and total interest payable on a fixed term repayment mortage
Learn moreNewsroom
The latest property market and economic news
Get the insights you need to find your next property investment opportunity.
Try PropertyData for free for 14-days with no commitment. Monthly rolling subscription after trial, cancel at any time.
Signup for freeLimit reached
Sorry, you've reached your monthly search limit.
Upgrade your plan for more searches.
UpgradeUpgrade to download PDFs
There are many places in PropertyData to export data as well-formatted PDF files, including Local Data, Plot Map, Valuations, property reports and more.
| Download PDFs | Branded PDFs | |
| Basic | ||
| Standard | ||
| Pro | ||
| Unlimited |
Transparent data promise
Where does the raw data come from?
Property listings seen on rightmove.co.uk, zoopla.co.uk and onthemarket.com.
How often is the data updated?
The data is updated in near real-time.
What time period does the data cover?
This is a real-time market snapshot - the data covers currently listed properties. Once properties are removed from the portal, they are soon removed from this tab.
How is the raw data processed?
Duplicates from multiple sources are matched and reconciled as far as possible. Listings with obvious errors, where price or number or bedrooms appear out of range, are discarded.
What are the statistics used?
Averages shown are the interquartile mean, a type of average that is insensitive to outliers while being its own distinct parameter. The 80% range means that 80% of the listed properties fall inside this range.
Where does the raw data come from?
Property listings seen on rightmove.co.uk, zoopla.co.uk and onthemarket.com.
How do you know the square footage of properties?
We use proprietary technology to read the square footage of properties from agent floorplans. Although we cannot determine the square footage for all properties, we can usually get sufficient coverage. Agents are sometimes known to inflate square footage, and this should be borne in mind as a weakness of this data.
How often is the data updated?
The data is updated in near real-time.
What time period does the data cover?
This is a real-time market snapshot - the data covers currently listed properties. Once properties are removed from the portal, they are soon removed from this tab.
How is the raw data processed?
Duplicates from multiple sources are matched and reconciled as far as possible. Listings with obvious errors, where price or number or bedrooms appear out of range, are discarded.
What are the statistics used?
The average shown is the interquartile mean, a type of average that is insensitive to outliers while being its own distinct parameter. The 80% range means that 80% of the listed properties fall inside this range.
Where does the raw data come from?
Property "price paid" data provided by the Land Registry.
How often is the data updated?
Once per month when released by the Land Registry, typically towards the end of each calendar month covering up to the end of the previous calendar month.
What time period does the data cover?
You can customise the time period using the filter at the top of the view. The default time period is up to 9 months back from today's date. The latest data covers the period up to 2026-06-30, although some sales that took place before this date may still be added in the coming months.
How is the raw data processed?
No additional processes are applied to this data.
What are the statistics used?
Averages shown are the interquartile mean, a type of average that is insensitive to outliers while being its own distinct parameter. The 80% range means that 80% of the listed properties fall inside this range.
Where does the raw data come from?
Property "price paid" data provided by the Land Registry, and Energy Performance Certificate (EPC) data provided by MHCLG.
How do you know the square footage of properties?
We match the Land Registry data to EPC data provided by MHCLG. Due to the fact that not all properties sold have had an EPC and vagaries of addressing in the UK, we are not able to determine the square footage of all properties, but we can usually get sufficient coverage.
How often is the data updated?
The private paid data is updated once per month when released by the Land Registry, typically towards the end of each calendar month covering up to the end of the previous calendar month. The energy performance certificate database is updated monthly.
What time period does the data cover?
You can customise the time period using the filter at the top of the view. The default time period is up to 9 months back from today's date. The latest data covers the period up to 2026-06-30, although some sales that took place before this date may still be added in the coming months.
How is the raw data processed?
No additional processes are applied to this data.
What are the statistics used?
The average shown is the interquartile mean, a type of average that is insensitive to outliers while being its own distinct parameter. The 80% range means that 80% of the listed properties fall inside this range.
Where does the raw data come from?
Property listings seen on rightmove.co.uk, zoopla.co.uk and onthemarket.com.
How often is the data updated?
The data is updated in near real-time.
What time period does the data cover?
This is a real-time market snapshot - the data covers currently listed properties. Once properties are removed from the portal, they are soon removed from this tab.
How is the raw data processed?
Duplicates from multiple sources are matched and reconciled as far as possible. Listings with obvious errors, where price or number or bedrooms appear out of range, are discarded.
What are the statistics used?
The average shown is the interquartile mean, a type of average that is insensitive to outliers while being its own distinct parameter. The 80% range means that 80% of the listed properties fall inside this range.
Where does the raw data come from?
Room let listings on SpareRoom, the UK's biggest room letting website.
How often is the data updated?
The data is updated in near real-time.
What time period does the data cover?
This is a real-time market snapshot - the data covers currently listed properties. Once properties are removed from SpareRoom, they are soon removed from this tab.
How is the raw data processed?
Listings with obvious errors, where price or number or bedrooms appear out of range, are discarded.
What are the statistics used?
The average shown is the interquartile mean, a type of average that is insensitive to outliers while being its own distinct parameter. The 80% range means that 80% of the listed properties fall inside this range.
Where does the raw data come from?
Property listings seen on rightmove.co.uk, zoopla.co.uk and onthemarket.com.
How often is the data updated?
The data is updated in near real-time.
What time period does the data cover?
This is a real-time market snapshot - the data covers currently listed properties. Once properties are removed from the portal, they are soon removed from this tab.
How is the raw data processed?
Duplicates from multiple sources are matched and reconciled as far as possible. Listings with obvious errors, where price or number or bedrooms appear out of range, are discarded. Yields are calculated by comparing only properties with the same number of bedrooms, e.g. 3-bedroom properties for rent with 3-bedroom properties for sale.
What is the yield calculation used?
The calculation used is (average_weekly_asking_rent * 52 / average_asking_price), expressed as a percentage. It is a top-line gross yield, meaning no expenses are considered.
What are the statistics used?
The average shown is the interquartile mean, a type of average that is insensitive to outliers while being its own distinct parameter. The 80% range means that 80% of the listed properties fall inside this range.
Where does the raw data come from?
Property listings seen on rightmove.co.uk, zoopla.co.uk and onthemarket.com.
How often is the data updated?
The data is updated in near real-time.
What time period does the data cover?
This is a real-time market snapshot - the data covers currently listed properties. Once properties are removed from Zoopla, Rightmove or Spareroom, they are soon removed from this tab.
How is the raw data processed?
Duplicates from multiple sources are matched and reconciled as far as possible. Yields are calculated by comparing only properties with the same number of bedrooms, e.g. 3-bedroom properties for rent with 3-bedroom properties for sale. For the SpareRoom data, hypothetical properties consisting of two to six average double rooms with shared bathrooms are used to derived average rent. For all sources, listings with obvious errors, where price or number or bedrooms appear out of range, are discarded.
What is the yield calculation used?
The calculation used is (average_weekly_asking_rent * 52 / average_asking_price), expressed as a percentage. It is a top-line gross yield, meaning no expenses are considered.
What are the statistics used?
The average shown is the interquartile mean, a type of average that is insensitive to outliers while being its own distinct parameter. The 80% range means that 80% of the listed properties fall inside this range.
Where does the raw data come from?
Property "price paid" data provided by the Land Registry.
How often is the data updated?
Once per month when released by the Land Registry, typically towards the end of each calendar month covering up to the end of the previous calendar month.
Zoopla Zed-index
What time period does the data cover?
The data covers transactions in the last six years
How is the raw data processed?
No additional processes are applied to this data.
What are the statistics used?
The average shown is the interquartile mean, a type of average that is insensitive to outliers while being its own distinct parameter. The 80% range means that 80% of the listed properties fall inside this range.
Where does the raw data come from?
Property listings seen on rightmove.co.uk, zoopla.co.uk and onthemarket.com.
How often is the data updated?
The listings data is updated in near real-time. The Land Registry data is updated once per month when released, typically towards the end of each calendar month covering up to the end of the previous calendar month.
What time period does the data cover?
The price paid data shown goes back to January 2015. The listings data is a real-time market snapshot - the data covers currently listed properties. Once properties are removed from the portal, they are soon removed from this tab.
How is the raw data processed?
Duplicates from multiple sources are matched and reconciled as far as possible. Listings with obvious errors, where price or number or bedrooms appear out of range, are discarded.
What are the calculations used?
Average sales per month are for the last 3 finalised months. Turnover is average sales per month divided by total for sale. Inventory is 100 divided by turnover.
Where does the raw data come from?
Property listings seen on rightmove.co.uk, zoopla.co.uk and onthemarket.com.
How often is the data updated?
The listings data is updated in near real-time. The Land Registry data is updated once per month when released, typically towards the end of each calendar month covering up to the end of the previous calendar month.
What time period does the data cover?
This is a real-time market snapshot - the data covers currently listed properties. Once properties are removed from the portal, they are soon removed from this tab.
How is the raw data processed?
Duplicates from multiple sources are matched and reconciled as far as possible. Listings with obvious errors, where price or number or bedrooms appear out of range, are discarded.
Where does the raw data come from?
We receive data on the extent and corporate ownership of all land titles in England & Wales from the Land Registry.
How often is the data updated?
The data is updated once per month when released, typically in the first few days of each calendar month.
What time period does the data cover?
This is an ownership snapshot - the data represents ownership as recorded by the Land Registry at the last monthly export.
How is the raw data processed?
No additional processes are applied to this data.
Where does the raw data come from?
We source different expert forecasts Savills, Knight Frank, OBR
How often is the data updated?
The data is updated annually when new forecasts are released, typically towards the beginning of the year.
How is the raw data processed?
We calculate a consensus forecast using a simple mean average.
Where does the raw data come from?
Quoting rent data is a proprietary data set based on the 2026 Valuation Office Agency (VOA) rateable values, combined with floor area data from MHCLG, adjusted for current market conditions.
What does "Quoting Rent" mean?
Quoting Rent reflects the estimated headline rent a property would achieve, based on official valuations adjusted for current conditions. This is the "face value" rent before any incentives such as rent-free periods, stepped rents or capital contributions are taken into account.
How is the floor area determined?
Floor areas are derived from MCHLG data. We use NIA (Net Internal Area) for retail, offices and leisure; GIA (Gross Internal Area) for industrial.
How often is the data updated?
The VOA data is based on the 2026 rating list, which is turn is based on 2024 comparables. This will be updated when a newer rating list is available. MCHLG data is updated regularly as new certificates are issued.
How is the raw data processed?
Multiple data sources are matched and reconciled. Properties are grouped by type, and outliers are excluded from averages.
What are the statistics used?
Averages shown are the interquartile mean, a type of average that is insensitive to outliers while being its own distinct parameter.
Where does the raw data come from?
This tab combines data from multiple sources. The bedroom distribution comes from property listings on rightmove.co.uk, zoopla.co.uk and onthemarket.com. Internal area and energy scores come from Energy Performance Certificate (EPC) data provided by MHCLG. Property type data comes from the Office for National Statistics Census.
How often is the data updated?
The bedroom distribution from listings is updated in near real-time. The EPC data is updated monthly. The Census data is updated when new census results are released.
What time period does the data cover?
The bedroom distribution is a real-time market snapshot of currently listed properties. The EPC data covers certificates issued since the scheme began. The Census data is from the most recent census.
How is the raw data processed?
For listings data, duplicates from multiple sources are matched and reconciled. Listings with obvious errors are discarded. EPC and Census data is aggregated to the selected area.
Where does the raw data come from?
Tenure type and occupancy data comes from the Office for National Statistics Census.
How often is the data updated?
The data is updated when new census results are released, typically every 10 years.
What time period does the data cover?
The data is from the most recent census.
How is the raw data processed?
Census data is aggregated to the selected area. National averages are provided for comparison.
Where does the raw data come from?
Property listings seen on rightmove.co.uk and onthemarket.com.
How often is the data updated?
The data is updated in near real-time.
What time period does the data cover?
This is a real-time market snapshot - the data covers currently listed properties. Once properties are removed from the portal, they are soon removed from this tab.
How is the raw data processed?
Agent names are normalised across sources. Listings are grouped by agent and ranked by number of live listings.
Total Floor Area (TFA)
Total Floor Area is a measurement defined by MHCLG (Ministry of Housing, Communities and Local Government).
TFA includes all habitable rooms, kitchens, bathrooms, internal corridors, hallways, and built-in storage.
TFA excludes garages, external stores, and unheated conservatories.
Estimated value
This figure is our best estimate of the current value of this property.
It is calculated using the most recent transaction and the most recent internal area figures, combined with local market data and price indices.
Estimate confidence
The confidence level indicates how reliable our estimated value is likely to be for this property.
The property has sold recently, so the estimate is based on a known sale price adjusted for current market conditions.
The property has not sold recently, so the estimate relies more heavily on comparable local data and may be less precise.
Habitable rooms
Habitable rooms include any living room, sitting room, dining room, bedroom, study and similar; and also a non-separated conservatory. A kitchen/diner having a discrete seating area (with space for a table and four chairs) also counts as a habitable room.
A non-separated conservatory adds to the habitable room count if it has an internal quality door between it and the dwelling.
Excluded from the room count are any room used solely as a kitchen, utility room, bathroom, cloakroom, en-suite accommodation and similar and any hallway, stairs or landing; and also any room not having a window.
Full address