Online EPC Check and Energy Retrofit Reports

Are you in the process of buying or renting a property in the UK and need an online EPC check? Or are you a landlord who needs to view the energy efficiency of your properties? PropertyData's Plot Map tool is an easy way to perform an online EPC check.

What is an EPC?

An Energy Performance Certificate (EPC) is a document that outlines the energy efficiency of a property. It provides a rating from A to G, with A being the most energy efficient and G being the least. EPCs are required for all properties built, sold, or rented in the UK.

Why is an EPC important?

Having an EPC is crucial for property buyers, renters, and landlords. For buyers and renters, an EPC can help them understand a property's energy efficiency, which can impact the cost of utilities and overall living expenses. An EPC is a legal requirement for landlords, and failure to comply can result in fines and penalties.

What are the current EPC rules for landlords?

Currently all properties that are let to tenants require an EPC rating of ‘E’ or above. It is illegal to let a property with and F or G rating.

From 2025, all newly rented properties will be required to have an EPC rating of C or above. For existing tenancies, the new regulations won’t apply until 2028.

How can PropertyData's Plot Map help with an Online EPC Check?

PropertyData's Plot Map tool is a user-friendly and efficient way to perform an online EPC check for any property in the UK.

Perform an Online EPC Check with PropertyData's Plot Map

Enter the property's address or postcode, and the tool will provide an instant EPC report outlining the property's energy efficiency rating.

Access to Energy Retrofit Reports

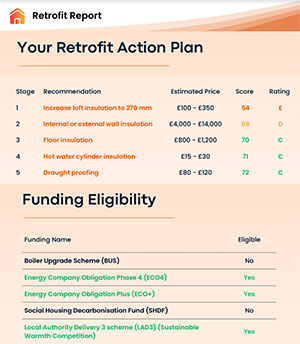
In addition, PropertyData's Plot Map tool also provides access to Energy Retrofit Reports, which outline recommended steps for improving a property's energy efficiency. This can be particularly helpful for landlords who want to improve the energy efficiency of their properties to comply with the upcoming changes to EPC regulations in 2023.

Performing an online EPC check with PropertyData's Plot Map tool is an easy and efficient way to ensure that you comply with EPC regulations and better understand the energy efficiency of any property in the UK. Try it today and make informed decisions about your property investments.

Why Use PropertyData for your Online EPC Check?

Whether you're a property investor, developer, or agent, PropertyData can help you make better-informed decisions and gain an edge over the competition. We designed our tools for anyone involved in the UK property market, from investors to landlords to estate agents. Here are some of the benefits of using PropertyData:

  • Comprehensive Property Data

    PropertyData provides comprehensive data on millions of properties across the UK, including historical sale and rental data, ownership information, and more. This data can be invaluable for making informed decisions about property investments and sales.

  • User-Friendly Interface

    PropertyData's user-friendly interface makes searching for and accessing property data accessible. The intuitive design and powerful search functions ensure that you can find the data you need quickly and easily.

  • Up-to-Date Information

    PropertyData is updated in real-time. You can be confident you're working with the most accurate and up-to-date property information.

  • Competitive Pricing

    We offer competitive pricing plans designed to meet the needs of businesses and individuals of all sizes.

Sign up to PropertyData for free

How PropertyData can help you

PropertyData investor illustration

Be a smarter property investor using data

Some of the ways property investors use PropertyData to boost their returns

I'm an investor
PropertyData data illustration

Make data-driven development decisions

How property developers can use market research in decision-making

I'm a developer
PropertyData clients illustration

Save time and impress your clients with data

How agents can use PropertyData to gain an edge on the competition

I'm an agent

Limit reached

Sorry, you've reached your monthly search limit.

Upgrade your account or purchase additional credits for more searches.

Upgrade Purchase credits

Upgrade to download PDFs

There are many places in PropertyData to export data as well-formatted PDF files, including Local Data, Plot Map, Valuations, property reports and more.

  Download PDFs Branded PDFs
Basic
Standard
Pro
Unlimited
Start your free trial now

Transparent data promise

Where does the raw data come from?

Property listings seen on rightmove.co.uk, zoopla.co.uk and onthemarket.com.

How often is the data updated?

The data is updated in near real-time.

What time period does the data cover?

This is a real-time market snapshot - the data covers currently listed properties. Once properties are removed from the portal, they are soon removed from this tab.

How is the raw data processed?

Duplicates from multiple sources are matched and reconciled as far as possible. Listings with obvious errors, where price or number or bedrooms appear out of range, are discarded.

What are the statistics used?

Averages shown are the interquartile mean, a type of average that is insensitive to outliers while being its own distinct parameter. The 80% range means that 80% of the listed properties fall inside this range.

Where does the raw data come from?

Property listings seen on rightmove.co.uk, zoopla.co.uk and onthemarket.com.

How do you know the square footage of properties?

We use proprietary technology to read the square footage of properties from agent floorplans. Although we cannot determine the square footage for all properties, we can usually get sufficient coverage. Agents are sometimes known to inflate square footage, and this should be borne in mind as a weakness of this data.

How often is the data updated?

The data is updated in near real-time.

What time period does the data cover?

This is a real-time market snapshot - the data covers currently listed properties. Once properties are removed from the portal, they are soon removed from this tab.

How is the raw data processed?

Duplicates from multiple sources are matched and reconciled as far as possible. Listings with obvious errors, where price or number or bedrooms appear out of range, are discarded.

What are the statistics used?

The average shown is the interquartile mean, a type of average that is insensitive to outliers while being its own distinct parameter. The 80% range means that 80% of the listed properties fall inside this range.

Where does the raw data come from?

Property "price paid" data provided by the Land Registry.

How often is the data updated?

Once per month when released by the Land Registry, typically towards the end of each calendar month covering up to the end of the previous calendar month.

What time period does the data cover?

You can customise the time period using the filter at the top of the view. The default time period is up to 9 months back from today's date. The latest data covers the period up to 2024-02-29, although some sales that took place before this date may still be added in the coming months.

How is the raw data processed?

No additional processes are applied to this data.

What are the statistics used?

Averages shown are the interquartile mean, a type of average that is insensitive to outliers while being its own distinct parameter. The 80% range means that 80% of the listed properties fall inside this range.

Where does the raw data come from?

Property "price paid" data provided by the Land Registry, and Energy Performance Certificate (EPC) data provided by Department for Levelling Up, Housing & Communities.

How do you know the square footage of properties?

We match the Land Registry data to EPC data provided by the Department for Levelling Up, Housing & Communities. Due to the fact that not all properties sold have had an EPC and vagaries of addressing in the UK, we are not able to determine the square footage of all properties, but we can usually get sufficient coverage.

How often is the data updated?

The private paid data is updated once per month when released by the Land Registry, typically towards the end of each calendar month covering up to the end of the previous calendar month. The energy performance certificate database is updated monthly.

What time period does the data cover?

You can customise the time period using the filter at the top of the view. The default time period is up to 9 months back from today's date. The latest data covers the period up to 2024-02-29, although some sales that took place before this date may still be added in the coming months.

How is the raw data processed?

No additional processes are applied to this data.

What are the statistics used?

The average shown is the interquartile mean, a type of average that is insensitive to outliers while being its own distinct parameter. The 80% range means that 80% of the listed properties fall inside this range.

Where does the raw data come from?

Property listings seen on rightmove.co.uk, zoopla.co.uk and onthemarket.com.

How often is the data updated?

The data is updated in near real-time.

What time period does the data cover?

This is a real-time market snapshot - the data covers currently listed properties. Once properties are removed from the portal, they are soon removed from this tab.

How is the raw data processed?

Duplicates from multiple sources are matched and reconciled as far as possible. Listings with obvious errors, where price or number or bedrooms appear out of range, are discarded.

What are the statistics used?

The average shown is the interquartile mean, a type of average that is insensitive to outliers while being its own distinct parameter. The 80% range means that 80% of the listed properties fall inside this range.

Where does the raw data come from?

Room let listings on SpareRoom, the UK's biggest room letting website.

How often is the data updated?

The data is updated in near real-time.

What time period does the data cover?

This is a real-time market snapshot - the data covers currently listed properties. Once properties are removed from SpareRoom, they are soon removed from this tab.

How is the raw data processed?

Listings with obvious errors, where price or number or bedrooms appear out of range, are discarded.

What are the statistics used?

The average shown is the interquartile mean, a type of average that is insensitive to outliers while being its own distinct parameter. The 80% range means that 80% of the listed properties fall inside this range.

Where does the raw data come from?

Property listings seen on rightmove.co.uk, zoopla.co.uk and onthemarket.com.

How often is the data updated?

The data is updated in near real-time.

What time period does the data cover?

This is a real-time market snapshot - the data covers currently listed properties. Once properties are removed from the portal, they are soon removed from this tab.

How is the raw data processed?

Duplicates from multiple sources are matched and reconciled as far as possible. Listings with obvious errors, where price or number or bedrooms appear out of range, are discarded. Yields are calculated by comparing only properties with the same number of bedrooms, e.g. 3-bedroom properties for rent with 3-bedroom properties for sale.

What is the yield calculation used?

The calculation used is (average_weekly_asking_rent * 52 / average_asking_price), expressed as a percentage. It is a top-line gross yield, meaning no expenses are considered.

What are the statistics used?

The average shown is the interquartile mean, a type of average that is insensitive to outliers while being its own distinct parameter. The 80% range means that 80% of the listed properties fall inside this range.

Where does the raw data come from?

Property listings seen on rightmove.co.uk, zoopla.co.uk and onthemarket.com.

How often is the data updated?

The data is updated in near real-time.

What time period does the data cover?

This is a real-time market snapshot - the data covers currently listed properties. Once properties are removed from Zoopla, Rightmove or Spareroom, they are soon removed from this tab.

How is the raw data processed?

Duplicates from multiple sources are matched and reconciled as far as possible. Yields are calculated by comparing only properties with the same number of bedrooms, e.g. 3-bedroom properties for rent with 3-bedroom properties for sale. For the SpareRoom data, hypothetical properties consisting of two to six average double rooms with shared bathrooms are used to derived average rent. For all sources, listings with obvious errors, where price or number or bedrooms appear out of range, are discarded.

What is the yield calculation used?

The calculation used is (average_weekly_asking_rent * 52 / average_asking_price), expressed as a percentage. It is a top-line gross yield, meaning no expenses are considered.

What are the statistics used?

The average shown is the interquartile mean, a type of average that is insensitive to outliers while being its own distinct parameter. The 80% range means that 80% of the listed properties fall inside this range.

Where does the raw data come from?

Property "price paid" data provided by the Land Registry.

How often is the data updated?

Once per month when released by the Land Registry, typically towards the end of each calendar month covering up to the end of the previous calendar month.

Zoopla Zed-index

What time period does the data cover?

The data covers transactions in the last six years

How is the raw data processed?

No additional processes are applied to this data.

What are the statistics used?

The average shown is the interquartile mean, a type of average that is insensitive to outliers while being its own distinct parameter. The 80% range means that 80% of the listed properties fall inside this range.

Where does the raw data come from?

Property listings seen on rightmove.co.uk, zoopla.co.uk and onthemarket.com.

How often is the data updated?

The listings data is updated in near real-time. The Land Registry data is updated once per month when released, typically towards the end of each calendar month covering up to the end of the previous calendar month.

What time period does the data cover?

The price paid data shown goes back to January 2015. The listings data is a real-time market snapshot - the data covers currently listed properties. Once properties are removed from the portal, they are soon removed from this tab.

How is the raw data processed?

Duplicates from multiple sources are matched and reconciled as far as possible. Listings with obvious errors, where price or number or bedrooms appear out of range, are discarded.

What are the calculations used?

Average sales per month are for the last 3 finalised months. Turnover is average sales per month divided by total for sale. Inventory is 100 divided by turnover.

Where does the raw data come from?

Property listings seen on rightmove.co.uk, zoopla.co.uk and onthemarket.com.

How often is the data updated?

The listings data is updated in near real-time. The Land Registry data is updated once per month when released, typically towards the end of each calendar month covering up to the end of the previous calendar month.

What time period does the data cover?

This is a real-time market snapshot - the data covers currently listed properties. Once properties are removed from the portal, they are soon removed from this tab.

How is the raw data processed?

Duplicates from multiple sources are matched and reconciled as far as possible. Listings with obvious errors, where price or number or bedrooms appear out of range, are discarded.

Where does the raw data come from?

We receive data on the extent and corporate ownership of all land titles in England & Wales from the Land Registry.

How often is the data updated?

The data is updated once per month when released, typically in the first few days of each calendar month.

What time period does the data cover?

This is an ownership snapshot - the data represents ownership as recorded by the Land Registry at the last monthly export.

How is the raw data processed?

No additional processes are applied to this data.

Where does the raw data come from?

We source different expert forecasts Savills, Knight Frank, OBR

How often is the data updated?

The data is updated annually when new forecasts are released, typically towards the beginning of the year.

How is the raw data processed?

We calculate a consensus forecast using a simple mean average.