The Flat Underperformance Problem: Why Apartments Are Losing Value

Flats have underperformed all other property types, including detached, semi-detached and terraced houses, in recent years. For PropertyData users, whether you are an investor, estate agent, or property developer, it is worth understanding why this is happening.

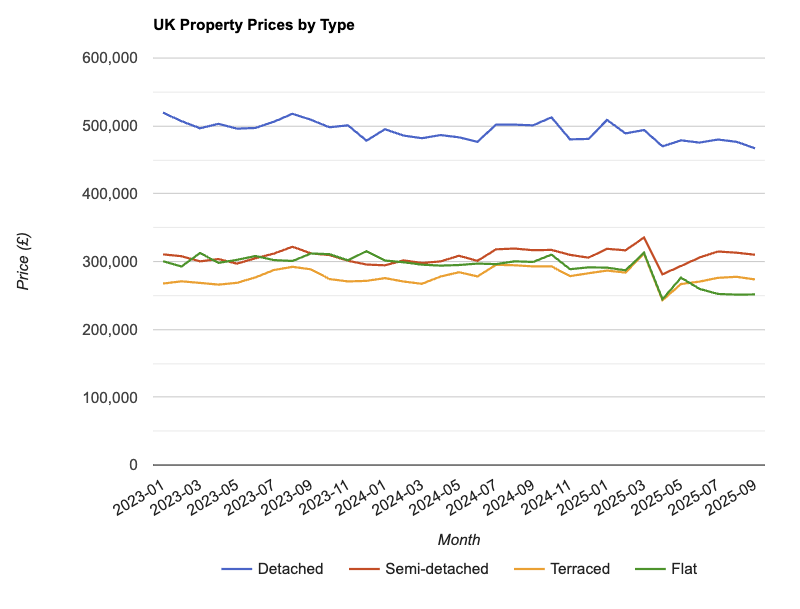
The Data Behind the Divide

The figures show a clear picture of market divergence. Across most UK regions, flats are underperforming houses by a noticeable margin. This trend challenges long-held assumptions about apartment investments being reliable and lower-risk alternatives to houses. What is particularly striking is that this is not a short-term issue. It reflects deeper changes in buyer and investor behaviour that developed during and after the pandemic.

Regional differences are significant. While some urban centres still maintain stronger flat markets, suburban and rural areas are seeing much stronger house price growth. London, traditionally a flat-dominated market, is experiencing particular stagnation, with some analysts predicting limited movement throughout 2026.

Why Flats Are Underperforming

Several connected factors are driving the weaker performance of flats:

  1. Post-Pandemic Space Preferences - The shift to remote and hybrid working has changed what many people want from a home. Buyers and renters now place more value on space, gardens, and outdoor areas. A flat with a small balcony often struggles to compete with a house that offers a garden and extra rooms for home offices.
  2. Rising Maintenance and Service Charges - Flat ownership comes with increasing service charges and maintenance costs. Building insurance, communal repairs, and management fees have risen sharply, reducing investment returns and making flats less affordable for owner-occupiers.
  3. Leasehold Complications - Ground rent disputes, concerns over lease length, and the costs of lease extensions continue to put buyers off. Properties with short leases, especially those under 80 years, face real challenges in securing mortgages and achieving strong resale values.
  4. Cladding Issues - The legacy of building safety concerns has created ongoing problems. Many flats in multi-storey buildings face remediation costs, insurance difficulties, and reduced marketability. This issue mainly affects apartment buildings and has weighed heavily on valuations.
  5. Mortgage Stress Testing - Flats often require larger mortgages relative to their value compared to houses. Stricter lending criteria and stress testing make flat purchases less accessible, particularly for first-time buyers and investors.
  6. New Build Competition - The large number of new build apartments, particularly in city centres, has created oversupply in certain markets. This competition puts pressure on the resale values of older flats and limits potential for capital growth.

The Investment Implications

Traditional flat investment strategies now need careful reassessment. Capital growth, historically a key driver of flat investment returns, is far less certain in many markets. However, this does not mean flats have become poor investments in every case.

Key considerations for investors:

  • Rental yield opportunities may still compensate for limited capital growth in some locations
  • Regional differences mean some flats continue to offer solid investment potential, particularly in areas with strong rental demand
  • Buy to let mortgage availability remains restricted, affecting investment feasibility
  • Finding undervalued flats requires detailed market analysis and good local knowledge

PropertyData users can use analytics tools to identify pockets of opportunity. Focus on areas with strong rental demand, younger demographics, and limited new build competition. Properties with reasonable service charges and longer leases generally represent better value.

What This Means for Different User Groups

For Estate Agents: Repositioning flat portfolios is increasingly important. Rather than competing on capital growth narratives, focus on rental yields, location convenience, and lifestyle benefits. Marketing strategies should highlight urban amenities, transport links, and community features that appeal to renters and downsizers.

For Property Developers: Design specifications now matter more than ever. Flats need to offer genuine differentiation, such as larger floor plans, premium finishes, outdoor space like terraces or communal gardens, and lower service charges. New build flats must provide a strong value proposition to justify premium pricing compared with resale alternatives.

For Investors: Portfolio rebalancing is sensible. Consider whether existing flat holdings still fit current market conditions. Evaluate each property on its own merits, including location, lease length, service charges, and rental demand, rather than treating flats as a single asset class.

For House Hunters: Understanding value retention is essential. Flats may offer lower entry prices, but long-term capital appreciation prospects are more limited. This affects long-term wealth-building strategies and should be considered carefully when making purchase decisions.

Looking Ahead to 2026

Market forecasts suggest flats are likely to continue underperforming houses throughout 2026, although the pace of decline may begin to stabilise. Several factors could help support a recovery:

  • Interest rate cuts making flat purchases more affordable
  • Progress in addressing building safety issues, reducing cladding-related valuation problems
  • Leasehold reform improving the attractiveness of flats
  • Urban regeneration projects creating new demand in city centres
  • Younger demographics entering the market with preferences better suited to flat living

PropertyData users should monitor these developments closely. Use analytics tools to track regional trends, service charge changes, and rental demand patterns. Identify properties that are well placed to benefit from any recovery.

Strategic Recommendations

Navigate the flat market carefully by:

  1. Carrying out thorough due diligence on service charges and lease terms before any transaction
  2. Focusing on locations with strong rental fundamentals rather than speculative capital growth
  3. Prioritising properties with longer leases and reasonable ground rent
  4. Using PropertyData tools to compare flat performance against local house price trends
  5. Identifying emerging opportunities in regeneration areas

Conclusion

The issue of flat underperformance is real, but it is not impossible to manage. The market is going through a period of structural adjustment as buyer preferences change and investment dynamics shift. For PropertyData users, this creates both challenges and opportunities.

The key is to move beyond outdated assumptions about flat investments. Success requires detailed analysis, strong regional understanding, and careful property-level evaluation. PropertyData analytics tools enable you to identify undervalued opportunities, track new trends, and make informed decisions in a changing landscape.

The flat market is not disappearing. It is simply evolving. Those who adapt their strategies to reflect current realities will find opportunities where others only see difficulties.

Sign up to PropertyData for free

How PropertyData can help you

PropertyData investor illustration

Be a smarter property investor using data

Some of the ways property investors use PropertyData to boost their returns

I'm an investor
PropertyData data illustration

Make data-driven development decisions

How property developers can use market research in decision-making

I'm a developer
PropertyData clients illustration

Save time and impress your clients with data

How agents can use PropertyData to gain an edge on the competition

I'm an agent

Limit reached

Sorry, you've reached your monthly search limit.

Upgrade your account for more searches.

Upgrade

Upgrade to download PDFs

There are many places in PropertyData to export data as well-formatted PDF files, including Local Data, Plot Map, Valuations, property reports and more.

  Download PDFs Branded PDFs
Basic
Standard
Pro
Unlimited
Start your free trial now

Transparent data promise

Where does the raw data come from?

Property listings seen on rightmove.co.uk, zoopla.co.uk and onthemarket.com.

How often is the data updated?

The data is updated in near real-time.

What time period does the data cover?

This is a real-time market snapshot - the data covers currently listed properties. Once properties are removed from the portal, they are soon removed from this tab.

How is the raw data processed?

Duplicates from multiple sources are matched and reconciled as far as possible. Listings with obvious errors, where price or number or bedrooms appear out of range, are discarded.

What are the statistics used?

Averages shown are the interquartile mean, a type of average that is insensitive to outliers while being its own distinct parameter. The 80% range means that 80% of the listed properties fall inside this range.

Where does the raw data come from?

Property listings seen on rightmove.co.uk, zoopla.co.uk and onthemarket.com.

How do you know the square footage of properties?

We use proprietary technology to read the square footage of properties from agent floorplans. Although we cannot determine the square footage for all properties, we can usually get sufficient coverage. Agents are sometimes known to inflate square footage, and this should be borne in mind as a weakness of this data.

How often is the data updated?

The data is updated in near real-time.

What time period does the data cover?

This is a real-time market snapshot - the data covers currently listed properties. Once properties are removed from the portal, they are soon removed from this tab.

How is the raw data processed?

Duplicates from multiple sources are matched and reconciled as far as possible. Listings with obvious errors, where price or number or bedrooms appear out of range, are discarded.

What are the statistics used?

The average shown is the interquartile mean, a type of average that is insensitive to outliers while being its own distinct parameter. The 80% range means that 80% of the listed properties fall inside this range.

Where does the raw data come from?

Property "price paid" data provided by the Land Registry.

How often is the data updated?

Once per month when released by the Land Registry, typically towards the end of each calendar month covering up to the end of the previous calendar month.

What time period does the data cover?

You can customise the time period using the filter at the top of the view. The default time period is up to 9 months back from today's date. The latest data covers the period up to 2025-12-15, although some sales that took place before this date may still be added in the coming months.

How is the raw data processed?

No additional processes are applied to this data.

What are the statistics used?

Averages shown are the interquartile mean, a type of average that is insensitive to outliers while being its own distinct parameter. The 80% range means that 80% of the listed properties fall inside this range.

Where does the raw data come from?

Property "price paid" data provided by the Land Registry, and Energy Performance Certificate (EPC) data provided by MHCLG.

How do you know the square footage of properties?

We match the Land Registry data to EPC data provided by MHCLG. Due to the fact that not all properties sold have had an EPC and vagaries of addressing in the UK, we are not able to determine the square footage of all properties, but we can usually get sufficient coverage.

How often is the data updated?

The private paid data is updated once per month when released by the Land Registry, typically towards the end of each calendar month covering up to the end of the previous calendar month. The energy performance certificate database is updated monthly.

What time period does the data cover?

You can customise the time period using the filter at the top of the view. The default time period is up to 9 months back from today's date. The latest data covers the period up to 2025-12-15, although some sales that took place before this date may still be added in the coming months.

How is the raw data processed?

No additional processes are applied to this data.

What are the statistics used?

The average shown is the interquartile mean, a type of average that is insensitive to outliers while being its own distinct parameter. The 80% range means that 80% of the listed properties fall inside this range.

Where does the raw data come from?

Property listings seen on rightmove.co.uk, zoopla.co.uk and onthemarket.com.

How often is the data updated?

The data is updated in near real-time.

What time period does the data cover?

This is a real-time market snapshot - the data covers currently listed properties. Once properties are removed from the portal, they are soon removed from this tab.

How is the raw data processed?

Duplicates from multiple sources are matched and reconciled as far as possible. Listings with obvious errors, where price or number or bedrooms appear out of range, are discarded.

What are the statistics used?

The average shown is the interquartile mean, a type of average that is insensitive to outliers while being its own distinct parameter. The 80% range means that 80% of the listed properties fall inside this range.

Where does the raw data come from?

Room let listings on SpareRoom, the UK's biggest room letting website.

How often is the data updated?

The data is updated in near real-time.

What time period does the data cover?

This is a real-time market snapshot - the data covers currently listed properties. Once properties are removed from SpareRoom, they are soon removed from this tab.

How is the raw data processed?

Listings with obvious errors, where price or number or bedrooms appear out of range, are discarded.

What are the statistics used?

The average shown is the interquartile mean, a type of average that is insensitive to outliers while being its own distinct parameter. The 80% range means that 80% of the listed properties fall inside this range.

Where does the raw data come from?

Property listings seen on rightmove.co.uk, zoopla.co.uk and onthemarket.com.

How often is the data updated?

The data is updated in near real-time.

What time period does the data cover?

This is a real-time market snapshot - the data covers currently listed properties. Once properties are removed from the portal, they are soon removed from this tab.

How is the raw data processed?

Duplicates from multiple sources are matched and reconciled as far as possible. Listings with obvious errors, where price or number or bedrooms appear out of range, are discarded. Yields are calculated by comparing only properties with the same number of bedrooms, e.g. 3-bedroom properties for rent with 3-bedroom properties for sale.

What is the yield calculation used?

The calculation used is (average_weekly_asking_rent * 52 / average_asking_price), expressed as a percentage. It is a top-line gross yield, meaning no expenses are considered.

What are the statistics used?

The average shown is the interquartile mean, a type of average that is insensitive to outliers while being its own distinct parameter. The 80% range means that 80% of the listed properties fall inside this range.

Where does the raw data come from?

Property listings seen on rightmove.co.uk, zoopla.co.uk and onthemarket.com.

How often is the data updated?

The data is updated in near real-time.

What time period does the data cover?

This is a real-time market snapshot - the data covers currently listed properties. Once properties are removed from Zoopla, Rightmove or Spareroom, they are soon removed from this tab.

How is the raw data processed?

Duplicates from multiple sources are matched and reconciled as far as possible. Yields are calculated by comparing only properties with the same number of bedrooms, e.g. 3-bedroom properties for rent with 3-bedroom properties for sale. For the SpareRoom data, hypothetical properties consisting of two to six average double rooms with shared bathrooms are used to derived average rent. For all sources, listings with obvious errors, where price or number or bedrooms appear out of range, are discarded.

What is the yield calculation used?

The calculation used is (average_weekly_asking_rent * 52 / average_asking_price), expressed as a percentage. It is a top-line gross yield, meaning no expenses are considered.

What are the statistics used?

The average shown is the interquartile mean, a type of average that is insensitive to outliers while being its own distinct parameter. The 80% range means that 80% of the listed properties fall inside this range.

Where does the raw data come from?

Property "price paid" data provided by the Land Registry.

How often is the data updated?

Once per month when released by the Land Registry, typically towards the end of each calendar month covering up to the end of the previous calendar month.

Zoopla Zed-index

What time period does the data cover?

The data covers transactions in the last six years

How is the raw data processed?

No additional processes are applied to this data.

What are the statistics used?

The average shown is the interquartile mean, a type of average that is insensitive to outliers while being its own distinct parameter. The 80% range means that 80% of the listed properties fall inside this range.

Where does the raw data come from?

Property listings seen on rightmove.co.uk, zoopla.co.uk and onthemarket.com.

How often is the data updated?

The listings data is updated in near real-time. The Land Registry data is updated once per month when released, typically towards the end of each calendar month covering up to the end of the previous calendar month.

What time period does the data cover?

The price paid data shown goes back to January 2015. The listings data is a real-time market snapshot - the data covers currently listed properties. Once properties are removed from the portal, they are soon removed from this tab.

How is the raw data processed?

Duplicates from multiple sources are matched and reconciled as far as possible. Listings with obvious errors, where price or number or bedrooms appear out of range, are discarded.

What are the calculations used?

Average sales per month are for the last 3 finalised months. Turnover is average sales per month divided by total for sale. Inventory is 100 divided by turnover.

Where does the raw data come from?

Property listings seen on rightmove.co.uk, zoopla.co.uk and onthemarket.com.

How often is the data updated?

The listings data is updated in near real-time. The Land Registry data is updated once per month when released, typically towards the end of each calendar month covering up to the end of the previous calendar month.

What time period does the data cover?

This is a real-time market snapshot - the data covers currently listed properties. Once properties are removed from the portal, they are soon removed from this tab.

How is the raw data processed?

Duplicates from multiple sources are matched and reconciled as far as possible. Listings with obvious errors, where price or number or bedrooms appear out of range, are discarded.

Where does the raw data come from?

We receive data on the extent and corporate ownership of all land titles in England & Wales from the Land Registry.

How often is the data updated?

The data is updated once per month when released, typically in the first few days of each calendar month.

What time period does the data cover?

This is an ownership snapshot - the data represents ownership as recorded by the Land Registry at the last monthly export.

How is the raw data processed?

No additional processes are applied to this data.

Where does the raw data come from?

We source different expert forecasts Savills, Knight Frank, OBR

How often is the data updated?

The data is updated annually when new forecasts are released, typically towards the beginning of the year.

How is the raw data processed?

We calculate a consensus forecast using a simple mean average.

Where does the raw data come from?

Quoting rent data is a proprietary data set based on the 2026 Valuation Office Agency (VOA) rateable values, combined with floor area data from MHCLG, adjusted for current market conditions.

What does "Quoting Rent" mean?

Quoting Rent reflects the estimated headline rent a property would achieve, based on official valuations adjusted for current conditions. This is the "face value" rent before any incentives such as rent-free periods, stepped rents or capital contributions are taken into account.

How is the floor area determined?

Floor areas are derived from MCHLG data. We use NIA (Net Internal Area) for retail, offices and leisure; GIA (Gross Internal Area) for industrial.

How often is the data updated?

The VOA data is based on the 2026 rating list, which is turn is based on 2024 comparables. This will be updated when a newer rating list is available. MCHLG data is updated regularly as new certificates are issued.

How is the raw data processed?

Multiple data sources are matched and reconciled. Properties are grouped by type, and outliers are excluded from averages.

What are the statistics used?

Averages shown are the interquartile mean, a type of average that is insensitive to outliers while being its own distinct parameter.

Where does the raw data come from?

This tab combines data from multiple sources. The bedroom distribution comes from property listings on rightmove.co.uk, zoopla.co.uk and onthemarket.com. Internal area and energy scores come from Energy Performance Certificate (EPC) data provided by MHCLG. Property type data comes from the Office for National Statistics Census.

How often is the data updated?

The bedroom distribution from listings is updated in near real-time. The EPC data is updated monthly. The Census data is updated when new census results are released.

What time period does the data cover?

The bedroom distribution is a real-time market snapshot of currently listed properties. The EPC data covers certificates issued since the scheme began. The Census data is from the most recent census.

How is the raw data processed?

For listings data, duplicates from multiple sources are matched and reconciled. Listings with obvious errors are discarded. EPC and Census data is aggregated to the selected area.

Where does the raw data come from?

Tenure type and occupancy data comes from the Office for National Statistics Census.

How often is the data updated?

The data is updated when new census results are released, typically every 10 years.

What time period does the data cover?

The data is from the most recent census.

How is the raw data processed?

Census data is aggregated to the selected area. National averages are provided for comparison.

Where does the raw data come from?

Property listings seen on rightmove.co.uk and onthemarket.com.

How often is the data updated?

The data is updated in near real-time.

What time period does the data cover?

This is a real-time market snapshot - the data covers currently listed properties. Once properties are removed from the portal, they are soon removed from this tab.

How is the raw data processed?

Agent names are normalised across sources. Listings are grouped by agent and ranked by number of live listings.

Total Floor Area (TFA)

Total Floor Area is a measurement defined by MHCLG (Ministry of Housing, Communities and Local Government).

TFA includes all habitable rooms, kitchens, bathrooms, internal corridors, hallways, and built-in storage.

TFA excludes garages, external stores, and unheated conservatories.