What's new April 2019
Introducing Saved Plots
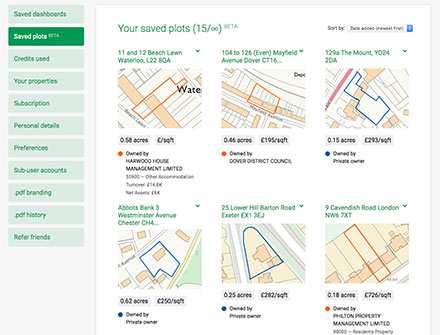
With our new Saved Plots feature, you can save plots of interest that you have inspected in the Plot Map tool.
To save a plot, find it on the Plot Map and click the plot, revealing its freehold title number and information. Then click the 'Save' button.
Plots in your Saved Plots will show a thumbnail of the plot outline, plus ownership information and the ability to sort by size in acres, local £/sqft or date added.
Also this month...
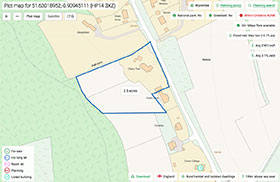
Plot Map design improvements
We've improved the design of the Plot Map to allow maximum screen space for the map, particularly when viewed on smaller laptop screens.
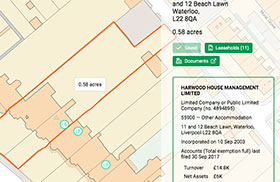
More corporate owner data
The Plot Map tool now shows more ownership data than ever for plots owned by corporate entities. New data allows you to see at a glance the turnover, net assets and more from the company's most recently filed accounts.
Feature ideas? Questions? Don't hesitate to contact us.
Best wishes,
The PropertyData team


