Enhancing property value with contemporary glass features in kitchen upgrades

Incorporating contemporary glass elements into kitchen renovations is becoming increasingly popular among property investors. These modern features not only enhance aesthetics but also offer functional benefits that appeal to potential buyers and tenants. Understanding how to integrate these elements effectively can significantly impact property valuations.

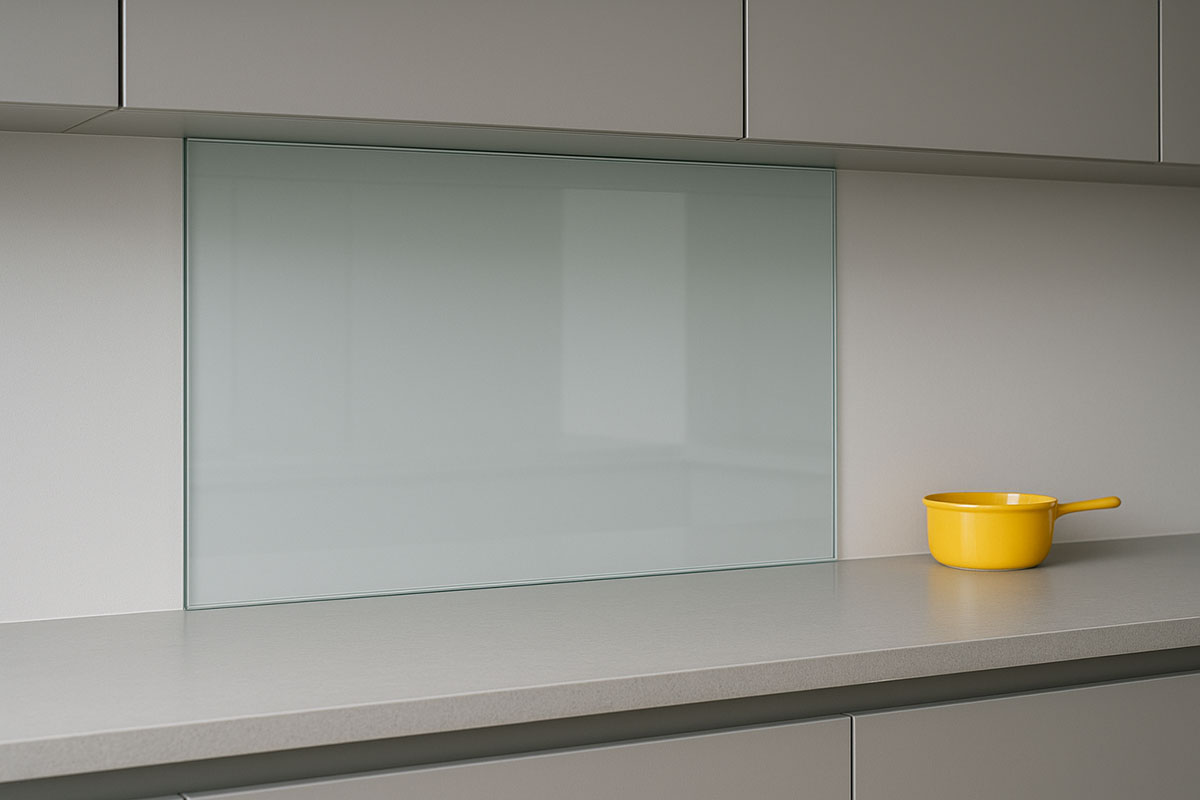
As trends in home renovations evolve, integrating sleek and sophisticated designs becomes crucial. One such trend is the installation of a glass splashback, which adds a touch of elegance to any kitchen space. These features are not merely decorative; they serve functional purposes that enhance the overall usability and appeal of the kitchen. For property investors, identifying such trends can be vital for maximizing rental prospects and resale value. In addition, selecting the right type of glass and incorporating it into the design thoughtfully can make a significant difference in how a property is perceived by potential buyers or tenants.

Aesthetic and functional benefits of glass splashbacks

The use of glass splashbacks in kitchen upgrades offers a seamless blend of style and practicality. These elements provide a sleek, modern look that can instantly elevate the appearance of your kitchen, making it more appealing to discerning buyers or renters. The reflective quality of glass enhances natural light, creating an illusion of a larger, more inviting space. This transformation can be particularly beneficial in smaller kitchens where space optimization is key.

Functionally, glass splashbacks are designed for ease of maintenance. Unlike traditional tiles with grout lines that collect dirt, the smooth surface of glass makes cleaning effortless. This low-maintenance feature is highly attractive to busy homeowners who prioritize efficiency and cleanliness. Additionally, glass is resistant to heat and moisture, offering durability that ensures long-term value retention.

When considering design options, it's important to select colours and patterns that complement your existing decor while maintaining a timeless appeal. Customization options allow you to tailor the splashback to fit specific preferences, whether through colour choices or bespoke designs. This personalization aspect further enhances the kitchen's aesthetic value and aligns with modern design trends.

Boosting property value through modern upgrades

Integrating contemporary glass features into your kitchen can significantly boost your property's market value. Buyers and tenants are often drawn to properties that offer both aesthetic appeal and practical benefits, which these upgrades deliver effectively. A well-designed kitchen with modern elements like glass splashbacks can set your property apart in competitive markets.

The investment in such upgrades tends to yield high returns due to increased interest from potential buyers or tenants willing to pay a premium for modern amenities. Properties featuring these enhancements often experience shorter time on the market, reducing vacancy periods for landlords and accelerating sales processes for sellers.

To optimize this value enhancement, consider aligning your kitchen renovation choices with current market trends and buyer preferences. Properties showcasing contemporary designs attract higher bids, demonstrating the importance of strategic investment in these features. Regularly updating your knowledge about design trends can ensure you make informed decisions that maximize property appeal.

Maintenance tips and design considerations

Maintaining a glass splashback requires minimal effort compared to traditional materials, yet there are specific tips to ensure its longevity. Regular cleaning with non-abrasive cleaners preserves its pristine condition while preventing scratches. Using protective coatings can also enhance resistance against stains and fingerprints.

Design considerations play a crucial role in maximizing the impact of your glass features. Opt for tempered glass to ensure safety and durability, especially in high-traffic areas like kitchens. The choice of colour or pattern should harmonize with other elements within the space, creating a cohesive look that appeals universally.

For those considering customization options, working with experienced designers or suppliers can provide insights into innovative solutions tailored to your property's unique characteristics. This collaboration ensures that your renovation not only meets aesthetic goals but also adheres to functional requirements specific to your lifestyle needs.

Data-driven insights on property valuations

A data-driven approach underscores the significance of contemporary glass features in elevating property value. By analyzing market data, you can assess how these upgrades influence buyer behaviour and pricing trends within your area. Properties with updated kitchens featuring modern amenities like glass splashbacks command higher prices and attract more interest.

Utilizing site data allows you to benchmark your property's offerings against similar listings, providing a clear picture of competitive advantages gained through these enhancements. This information empowers you to make strategic decisions regarding renovation investments based on factual insights rather than assumptions.

The emphasis on data aligns with investor priorities focused on maximizing returns through informed decision-making processes. As you navigate renovation projects, leveraging reliable data sources ensures that your investments align with market demands while optimizing property performance over time.

Sign up to PropertyData for free

How PropertyData can help you

PropertyData investor illustration

Be a smarter property investor using data

Some of the ways property investors use PropertyData to boost their returns

I'm an investor
PropertyData data illustration

Make data-driven development decisions

How property developers can use market research in decision-making

I'm a developer
PropertyData clients illustration

Save time and impress your clients with data

How agents can use PropertyData to gain an edge on the competition

I'm an agent

Limit reached

Sorry, you've reached your monthly search limit.

Upgrade your account for more searches.

Upgrade

Upgrade to download PDFs

There are many places in PropertyData to export data as well-formatted PDF files, including Local Data, Plot Map, Valuations, property reports and more.

  Download PDFs Branded PDFs
Basic
Standard
Pro
Unlimited
Start your free trial now

Transparent data promise

Where does the raw data come from?

Property listings seen on rightmove.co.uk, zoopla.co.uk and onthemarket.com.

How often is the data updated?

The data is updated in near real-time.

What time period does the data cover?

This is a real-time market snapshot - the data covers currently listed properties. Once properties are removed from the portal, they are soon removed from this tab.

How is the raw data processed?

Duplicates from multiple sources are matched and reconciled as far as possible. Listings with obvious errors, where price or number or bedrooms appear out of range, are discarded.

What are the statistics used?

Averages shown are the interquartile mean, a type of average that is insensitive to outliers while being its own distinct parameter. The 80% range means that 80% of the listed properties fall inside this range.

Where does the raw data come from?

Property listings seen on rightmove.co.uk, zoopla.co.uk and onthemarket.com.

How do you know the square footage of properties?

We use proprietary technology to read the square footage of properties from agent floorplans. Although we cannot determine the square footage for all properties, we can usually get sufficient coverage. Agents are sometimes known to inflate square footage, and this should be borne in mind as a weakness of this data.

How often is the data updated?

The data is updated in near real-time.

What time period does the data cover?

This is a real-time market snapshot - the data covers currently listed properties. Once properties are removed from the portal, they are soon removed from this tab.

How is the raw data processed?

Duplicates from multiple sources are matched and reconciled as far as possible. Listings with obvious errors, where price or number or bedrooms appear out of range, are discarded.

What are the statistics used?

The average shown is the interquartile mean, a type of average that is insensitive to outliers while being its own distinct parameter. The 80% range means that 80% of the listed properties fall inside this range.

Where does the raw data come from?

Property "price paid" data provided by the Land Registry.

How often is the data updated?

Once per month when released by the Land Registry, typically towards the end of each calendar month covering up to the end of the previous calendar month.

What time period does the data cover?

You can customise the time period using the filter at the top of the view. The default time period is up to 9 months back from today's date. The latest data covers the period up to 2025-12-15, although some sales that took place before this date may still be added in the coming months.

How is the raw data processed?

No additional processes are applied to this data.

What are the statistics used?

Averages shown are the interquartile mean, a type of average that is insensitive to outliers while being its own distinct parameter. The 80% range means that 80% of the listed properties fall inside this range.

Where does the raw data come from?

Property "price paid" data provided by the Land Registry, and Energy Performance Certificate (EPC) data provided by Department for Levelling Up, Housing & Communities.

How do you know the square footage of properties?

We match the Land Registry data to EPC data provided by the Department for Levelling Up, Housing & Communities. Due to the fact that not all properties sold have had an EPC and vagaries of addressing in the UK, we are not able to determine the square footage of all properties, but we can usually get sufficient coverage.

How often is the data updated?

The private paid data is updated once per month when released by the Land Registry, typically towards the end of each calendar month covering up to the end of the previous calendar month. The energy performance certificate database is updated monthly.

What time period does the data cover?

You can customise the time period using the filter at the top of the view. The default time period is up to 9 months back from today's date. The latest data covers the period up to 2025-12-15, although some sales that took place before this date may still be added in the coming months.

How is the raw data processed?

No additional processes are applied to this data.

What are the statistics used?

The average shown is the interquartile mean, a type of average that is insensitive to outliers while being its own distinct parameter. The 80% range means that 80% of the listed properties fall inside this range.

Where does the raw data come from?

Property listings seen on rightmove.co.uk, zoopla.co.uk and onthemarket.com.

How often is the data updated?

The data is updated in near real-time.

What time period does the data cover?

This is a real-time market snapshot - the data covers currently listed properties. Once properties are removed from the portal, they are soon removed from this tab.

How is the raw data processed?

Duplicates from multiple sources are matched and reconciled as far as possible. Listings with obvious errors, where price or number or bedrooms appear out of range, are discarded.

What are the statistics used?

The average shown is the interquartile mean, a type of average that is insensitive to outliers while being its own distinct parameter. The 80% range means that 80% of the listed properties fall inside this range.

Where does the raw data come from?

Room let listings on SpareRoom, the UK's biggest room letting website.

How often is the data updated?

The data is updated in near real-time.

What time period does the data cover?

This is a real-time market snapshot - the data covers currently listed properties. Once properties are removed from SpareRoom, they are soon removed from this tab.

How is the raw data processed?

Listings with obvious errors, where price or number or bedrooms appear out of range, are discarded.

What are the statistics used?

The average shown is the interquartile mean, a type of average that is insensitive to outliers while being its own distinct parameter. The 80% range means that 80% of the listed properties fall inside this range.

Where does the raw data come from?

Property listings seen on rightmove.co.uk, zoopla.co.uk and onthemarket.com.

How often is the data updated?

The data is updated in near real-time.

What time period does the data cover?

This is a real-time market snapshot - the data covers currently listed properties. Once properties are removed from the portal, they are soon removed from this tab.

How is the raw data processed?

Duplicates from multiple sources are matched and reconciled as far as possible. Listings with obvious errors, where price or number or bedrooms appear out of range, are discarded. Yields are calculated by comparing only properties with the same number of bedrooms, e.g. 3-bedroom properties for rent with 3-bedroom properties for sale.

What is the yield calculation used?

The calculation used is (average_weekly_asking_rent * 52 / average_asking_price), expressed as a percentage. It is a top-line gross yield, meaning no expenses are considered.

What are the statistics used?

The average shown is the interquartile mean, a type of average that is insensitive to outliers while being its own distinct parameter. The 80% range means that 80% of the listed properties fall inside this range.

Where does the raw data come from?

Property listings seen on rightmove.co.uk, zoopla.co.uk and onthemarket.com.

How often is the data updated?

The data is updated in near real-time.

What time period does the data cover?

This is a real-time market snapshot - the data covers currently listed properties. Once properties are removed from Zoopla, Rightmove or Spareroom, they are soon removed from this tab.

How is the raw data processed?

Duplicates from multiple sources are matched and reconciled as far as possible. Yields are calculated by comparing only properties with the same number of bedrooms, e.g. 3-bedroom properties for rent with 3-bedroom properties for sale. For the SpareRoom data, hypothetical properties consisting of two to six average double rooms with shared bathrooms are used to derived average rent. For all sources, listings with obvious errors, where price or number or bedrooms appear out of range, are discarded.

What is the yield calculation used?

The calculation used is (average_weekly_asking_rent * 52 / average_asking_price), expressed as a percentage. It is a top-line gross yield, meaning no expenses are considered.

What are the statistics used?

The average shown is the interquartile mean, a type of average that is insensitive to outliers while being its own distinct parameter. The 80% range means that 80% of the listed properties fall inside this range.

Where does the raw data come from?

Property "price paid" data provided by the Land Registry.

How often is the data updated?

Once per month when released by the Land Registry, typically towards the end of each calendar month covering up to the end of the previous calendar month.

Zoopla Zed-index

What time period does the data cover?

The data covers transactions in the last six years

How is the raw data processed?

No additional processes are applied to this data.

What are the statistics used?

The average shown is the interquartile mean, a type of average that is insensitive to outliers while being its own distinct parameter. The 80% range means that 80% of the listed properties fall inside this range.

Where does the raw data come from?

Property listings seen on rightmove.co.uk, zoopla.co.uk and onthemarket.com.

How often is the data updated?

The listings data is updated in near real-time. The Land Registry data is updated once per month when released, typically towards the end of each calendar month covering up to the end of the previous calendar month.

What time period does the data cover?

The price paid data shown goes back to January 2015. The listings data is a real-time market snapshot - the data covers currently listed properties. Once properties are removed from the portal, they are soon removed from this tab.

How is the raw data processed?

Duplicates from multiple sources are matched and reconciled as far as possible. Listings with obvious errors, where price or number or bedrooms appear out of range, are discarded.

What are the calculations used?

Average sales per month are for the last 3 finalised months. Turnover is average sales per month divided by total for sale. Inventory is 100 divided by turnover.

Where does the raw data come from?

Property listings seen on rightmove.co.uk, zoopla.co.uk and onthemarket.com.

How often is the data updated?

The listings data is updated in near real-time. The Land Registry data is updated once per month when released, typically towards the end of each calendar month covering up to the end of the previous calendar month.

What time period does the data cover?

This is a real-time market snapshot - the data covers currently listed properties. Once properties are removed from the portal, they are soon removed from this tab.

How is the raw data processed?

Duplicates from multiple sources are matched and reconciled as far as possible. Listings with obvious errors, where price or number or bedrooms appear out of range, are discarded.

Where does the raw data come from?

We receive data on the extent and corporate ownership of all land titles in England & Wales from the Land Registry.

How often is the data updated?

The data is updated once per month when released, typically in the first few days of each calendar month.

What time period does the data cover?

This is an ownership snapshot - the data represents ownership as recorded by the Land Registry at the last monthly export.

How is the raw data processed?

No additional processes are applied to this data.

Where does the raw data come from?

We source different expert forecasts Savills, Knight Frank, OBR

How often is the data updated?

The data is updated annually when new forecasts are released, typically towards the beginning of the year.

How is the raw data processed?

We calculate a consensus forecast using a simple mean average.