Where to Invest in Property in 2024: Navigating the Market with Precision

In 2024, the need for precision in property investment decisions has never been more pronounced. With the correct information and strategic insight, investors can unlock significant value in various UK cities, each offering unique prospects for growth and returns.

By making informed decisions based on the latest postcode data and local data analysis, you can better understand an area's investment potential. So, in this article, we will learn where to invest in property in 2024 by navigating the market with precision using the latest tools and insights.

Understanding the 2024 Property Market

The UK's property market is influenced by several economic factors, from interest rates and inflation to employment rates and population growth. These elements impact property values, rental demand, and investment returns, making staying abreast of the latest trends and analyses worthwhile. Looking ahead to 2024, many analysts predict that the enhanced cost of living pressures, alongside higher interest rates, will bring about a mild downswing in house prices. This makes 2024 a strong year to invest in property due to the slightly lower prices expected.

Why Local and Postcode Data Matter

In the increasingly granular world of property investment, the significance of localised data is particularly pronounced. Postcode Data and Local Data services are invaluable tools, offering insights that can transform a general investment strategy into a targeted, high-return approach.

Postcode Data Service: This useful solution offers in-depth property market data at the postcode level. This gives investors keen insights into high-potential investment areas with incredible precision.

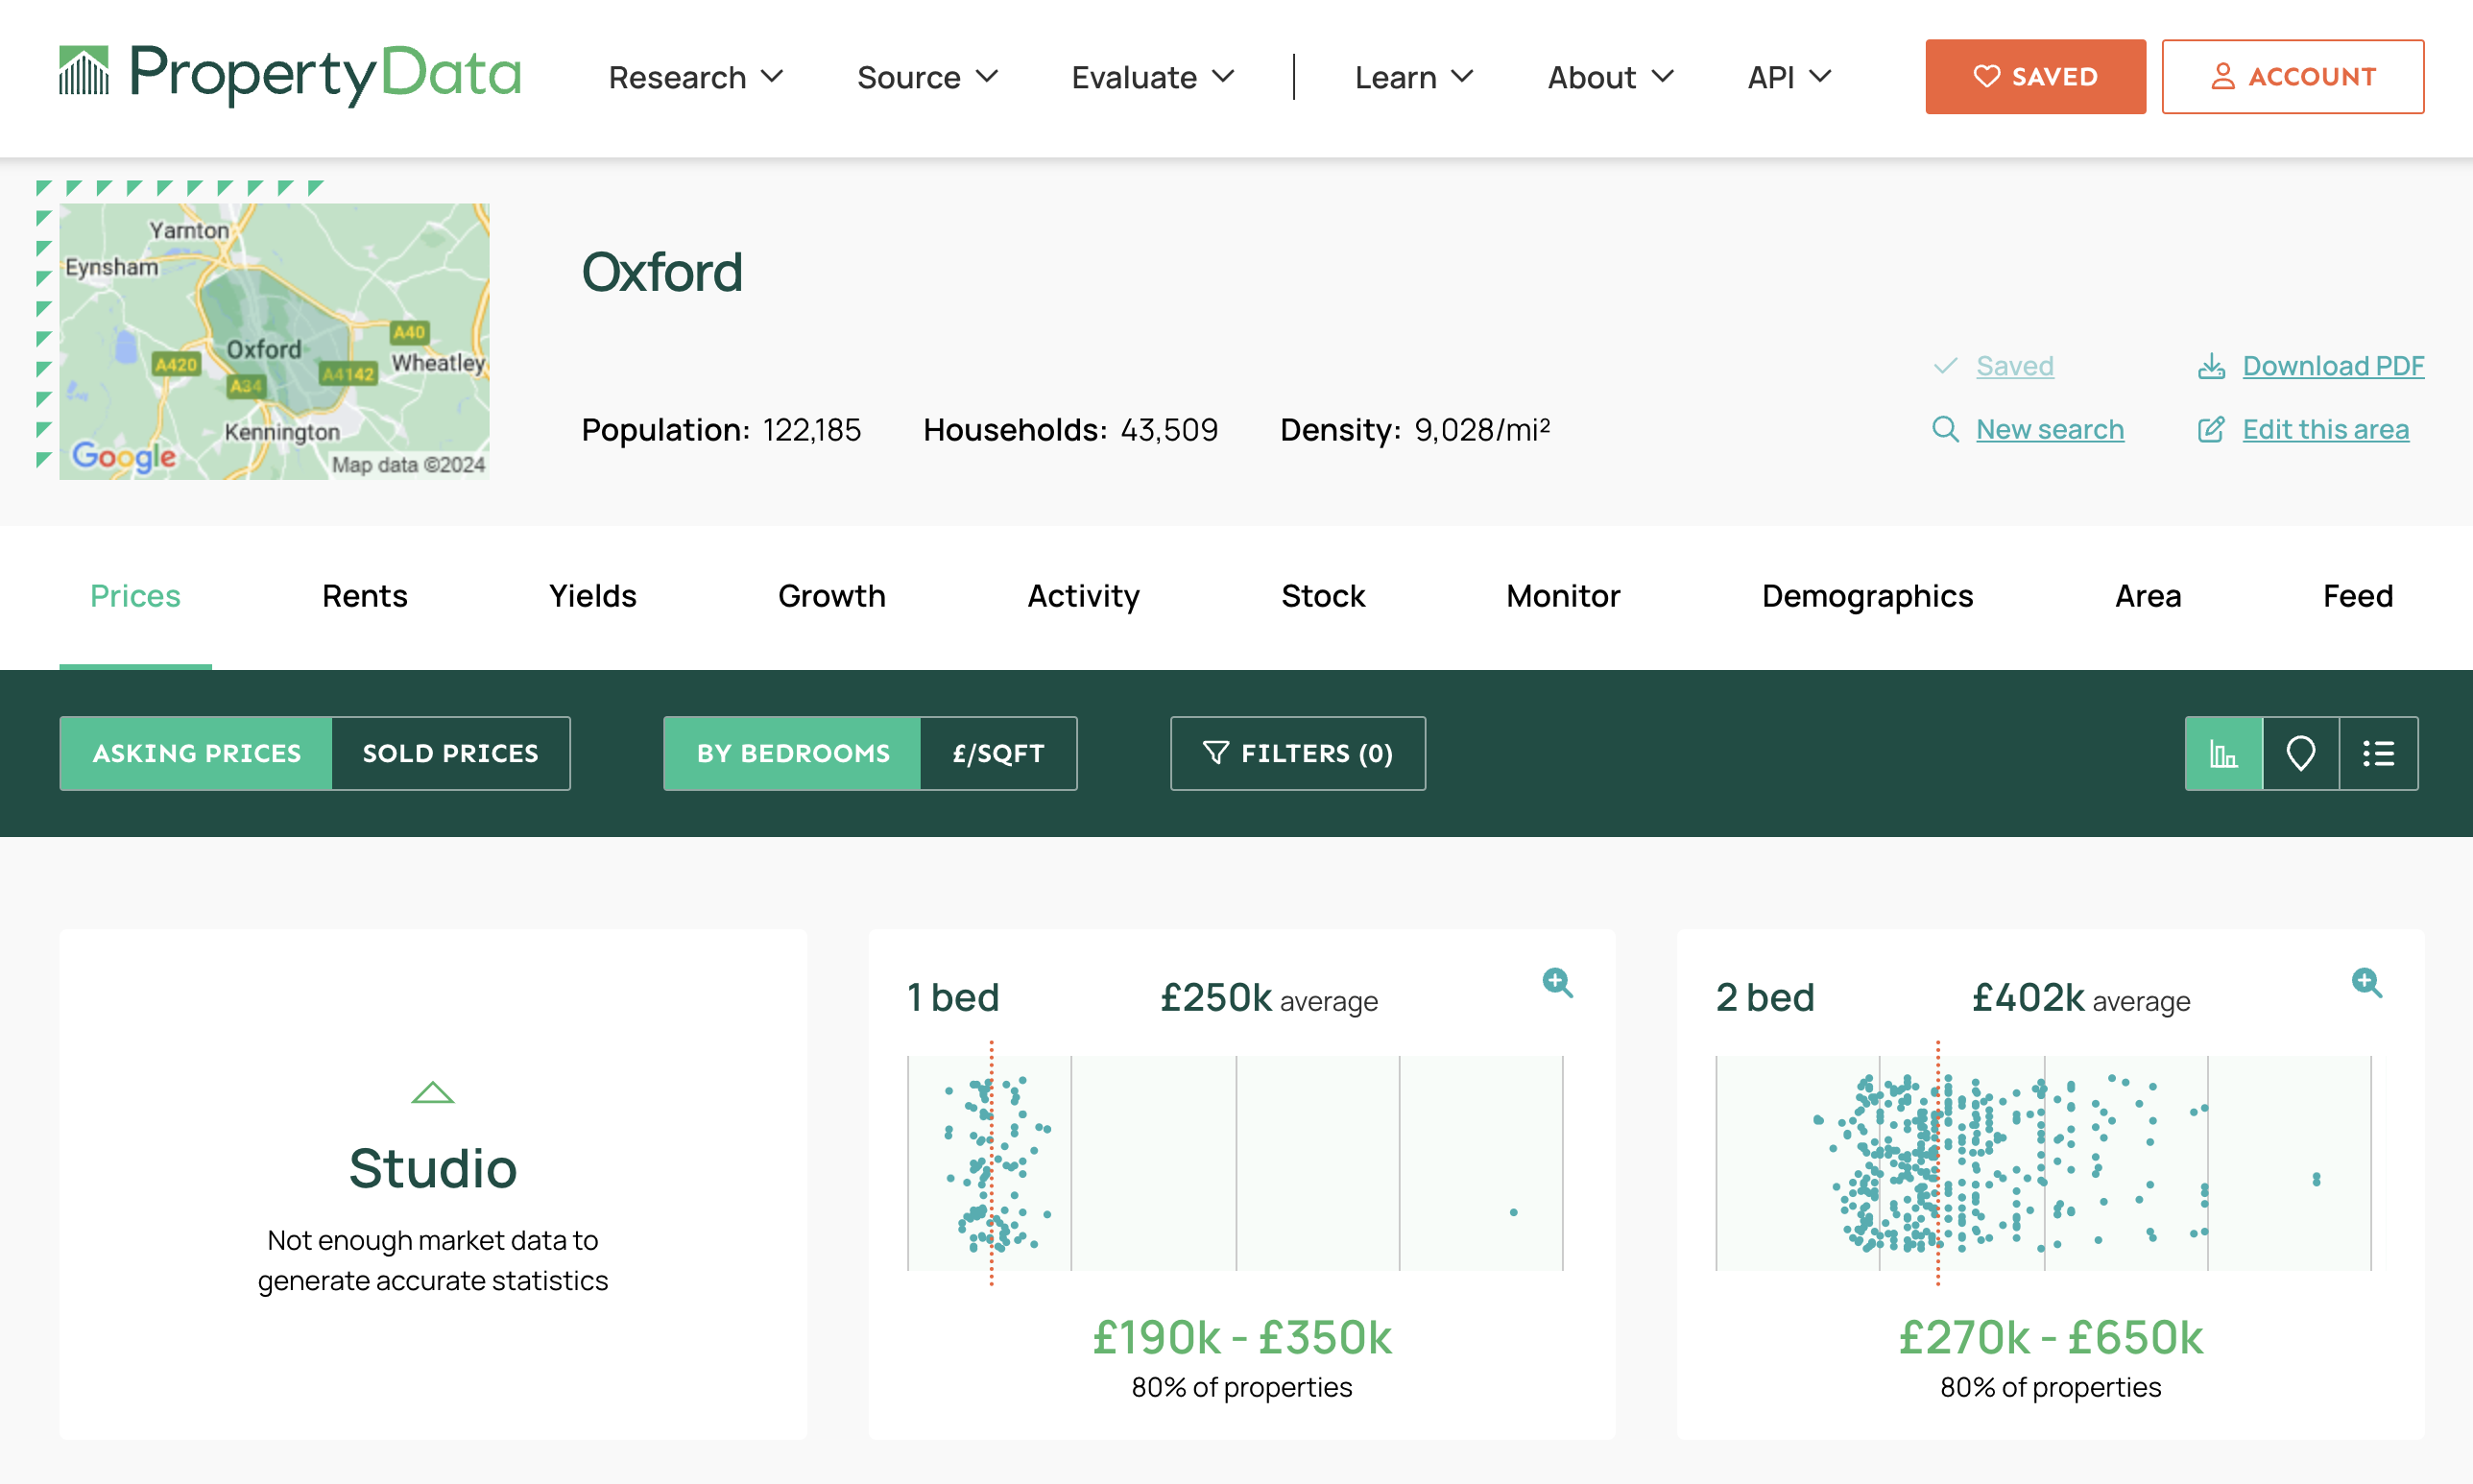
Local Data: Another helpful insight tool is looking at local data, which provides an overview of local market insights. It covers key demographics, average property prices, rental yields and other data to help investors make the best investment decisions.

Top Cities for Property Investment in 2024

The UK boasts several high-profile cities - and a handful of lesser-known ones - that offer tremendous property investment potential. These opportunities span far and wide, so you are accessible to a specific locale to find a property that will net you an excellent return on investment. So, let’s look at some of the top cities for property investment in 2024.

Birmingham

Recognised for its vibrant economy and growing population, Birmingham is the second biggest city in the UK and a prime spot for property investment. The city boasts a strong rental market, driven by a significant student population and an increasing number of young professionals. That means you can invest in property Birmingham-wide and yield substantial returns.

Manchester

Considering property investment in Manchester, 2024 is a great year to pull the trigger. Manchester is experiencing economic growth, making it stand out as a top location for property investment in 2024. Its diverse economy and cultural appeal make it a hotspot for residential and commercial investments.

London

Despite its high entry cost, London remains a lucrative market for investors, offering unmatched capital growth potential. The best areas to buy property in London in 2024 will be those with planned infrastructure developments, enhancing connectivity and desirability. In particular, several East and Southeast London postcodes are offering a significant return on investment.

Bristol

Bristol's market is buoyed by its thriving tech industry and fantastic quality of life, presenting excellent opportunities for investment. Some of Bristol's most lucrative real estate investment opportunities are in areas slated for development and regeneration.

Glasgow

Glasgow's property market is poised for growth in 2024, with investment insights pointing towards areas with rising demand for housing driven by the city's economic expansion and educational institutions. Regarding Glasgow property investment insights, 2024 is a good year for student accommodation around the west end and south side of the city.

Liverpool

The property market trends in Liverpool in 2024 indicate a strong rental demand, especially in areas close to the city centre and the universities, making it an attractive location for investors. Other options include finding some pockets of affluent neighbourhoods in Liverpool, which will offer excellent investment opportunities.

Sheffield

Offering a blend of affordability and potential for capital appreciation, Sheffield is emerging as a compelling choice for real estate investment, particularly in sectors catering to students and young professionals. If you’re looking to target high-value properties, then areas such as Broomhill offer excellent opportunities.

Using Postcode Data to Your Advantage

Leveraging the Postcode Data service involves identifying areas with high growth potential by analysing price trends, rental yields, and market demand. This approach can significantly enhance the likelihood of a successful investment. Below is a step-by-step breakdown of how it works:

Open Postcode Data: Open the Research menu and select Postcode Data.

Customised Search: Click on the customise columns to choose different datasets such as rental yields or crime rates.

Add Filters: Add filters to reduce the number of districts you’re searching through.

Compile Your Shortlist: With all of the postcode data available, you can begin creating a shortlist of areas aligning with your investment strategy.

Postcode Data Insights: Beyond the Numbers

Understanding Local Data goes beyond numbers; it's about interpreting market conditions, demographic shifts, and future development plans. These insights are crucial to assessing property values and rental demand in specific locales. Let’s go over how to use this innovative tool below:

Open Local Data: Click on the Local Data tool from the Research menu.

Enter a Postcode: Next, input a postcode district or the name of a town or area.

Customise Data: You can customise the data being collected on the next screen.

Browse Results: You can view everything in the dashboard after generating the results. You can view property prices, select specific date ranges, view rental yields and more.

The Local Data tool allows you to unlock insights using a huge amount of data. This will help guide your strategy and find the perfect investment opportunity.

Actionable Investment Strategies for 2024

2024 is a good year for purchasing property as prices appear to fall. Investors are advised to focus on diversification, risk management and long-term planning to maintain a healthy portfolio. Building a profitable property portfolio in 2024 involves a mix of residential and commercial properties, spread across different geographical areas to mitigate risks. So whether you’re a novice or a seasoned investor, feel free to plan, diversify your portfolio and manage risk as effectively as possible.

Navigating Challenges and Seizing Opportunities

While challenges such as market fluctuations and regulatory changes are inevitable, they also present investment opportunities. Staying informed and adaptable is key to overcoming obstacles and capitalising on the dynamics of the 2024 property market. One of the best ways to do that is by harnessing tools like Postcode Data and Local Data, as they will provide you with the insights you need to overcome the obstacles in 2024’s property market.

Conclusion

2024 looks promising for property investment, with several UK cities experiencing significant investment opportunities. Whether you’re considering inner-city investment in cities like London or want to target affluent neighbourhoods in locales such as Manchester, the key to success is insights. Innovative tools like Postcode Data and Local Data allow you to make the most well-informed investment decisions possible. So, if you want to enjoy enhanced risk management uncovering the best investment areas, these tools are indispensable. You can explore the Postcode Data and Local Data services at PropertyData for in-depth property market analysis and insights.

Sign up to PropertyData for free

How PropertyData can help you

PropertyData investor illustration

Be a smarter property investor using data

Some of the ways property investors use PropertyData to boost their returns

I'm an investor
PropertyData data illustration

Make data-driven development decisions

How property developers can use market research in decision-making

I'm a developer
PropertyData clients illustration

Save time and impress your clients with data

How agents can use PropertyData to gain an edge on the competition

I'm an agent

Limit reached

Sorry, you've reached your monthly search limit.

Upgrade your account or purchase additional credits for more searches.

Upgrade Purchase credits

Upgrade to download PDFs

There are many places in PropertyData to export data as well-formatted PDF files, including Local Data, Plot Map, Valuations, property reports and more.

  Download PDFs Branded PDFs
Basic
Standard
Pro
Unlimited
Start your free trial now

Transparent data promise

Where does the raw data come from?

Property listings seen on rightmove.co.uk, zoopla.co.uk and onthemarket.com.

How often is the data updated?

The data is updated in near real-time.

What time period does the data cover?

This is a real-time market snapshot - the data covers currently listed properties. Once properties are removed from the portal, they are soon removed from this tab.

How is the raw data processed?

Duplicates from multiple sources are matched and reconciled as far as possible. Listings with obvious errors, where price or number or bedrooms appear out of range, are discarded.

What are the statistics used?

Averages shown are the interquartile mean, a type of average that is insensitive to outliers while being its own distinct parameter. The 80% range means that 80% of the listed properties fall inside this range.

Where does the raw data come from?

Property listings seen on rightmove.co.uk, zoopla.co.uk and onthemarket.com.

How do you know the square footage of properties?

We use proprietary technology to read the square footage of properties from agent floorplans. Although we cannot determine the square footage for all properties, we can usually get sufficient coverage. Agents are sometimes known to inflate square footage, and this should be borne in mind as a weakness of this data.

How often is the data updated?

The data is updated in near real-time.

What time period does the data cover?

This is a real-time market snapshot - the data covers currently listed properties. Once properties are removed from the portal, they are soon removed from this tab.

How is the raw data processed?

Duplicates from multiple sources are matched and reconciled as far as possible. Listings with obvious errors, where price or number or bedrooms appear out of range, are discarded.

What are the statistics used?

The average shown is the interquartile mean, a type of average that is insensitive to outliers while being its own distinct parameter. The 80% range means that 80% of the listed properties fall inside this range.

Where does the raw data come from?

Property "price paid" data provided by the Land Registry.

How often is the data updated?

Once per month when released by the Land Registry, typically towards the end of each calendar month covering up to the end of the previous calendar month.

What time period does the data cover?

You can customise the time period using the filter at the top of the view. The default time period is up to 9 months back from today's date. The latest data covers the period up to 2024-02-29, although some sales that took place before this date may still be added in the coming months.

How is the raw data processed?

No additional processes are applied to this data.

What are the statistics used?

Averages shown are the interquartile mean, a type of average that is insensitive to outliers while being its own distinct parameter. The 80% range means that 80% of the listed properties fall inside this range.

Where does the raw data come from?

Property "price paid" data provided by the Land Registry, and Energy Performance Certificate (EPC) data provided by Department for Levelling Up, Housing & Communities.

How do you know the square footage of properties?

We match the Land Registry data to EPC data provided by the Department for Levelling Up, Housing & Communities. Due to the fact that not all properties sold have had an EPC and vagaries of addressing in the UK, we are not able to determine the square footage of all properties, but we can usually get sufficient coverage.

How often is the data updated?

The private paid data is updated once per month when released by the Land Registry, typically towards the end of each calendar month covering up to the end of the previous calendar month. The energy performance certificate database is updated monthly.

What time period does the data cover?

You can customise the time period using the filter at the top of the view. The default time period is up to 9 months back from today's date. The latest data covers the period up to 2024-02-29, although some sales that took place before this date may still be added in the coming months.

How is the raw data processed?

No additional processes are applied to this data.

What are the statistics used?

The average shown is the interquartile mean, a type of average that is insensitive to outliers while being its own distinct parameter. The 80% range means that 80% of the listed properties fall inside this range.

Where does the raw data come from?

Property listings seen on rightmove.co.uk, zoopla.co.uk and onthemarket.com.

How often is the data updated?

The data is updated in near real-time.

What time period does the data cover?

This is a real-time market snapshot - the data covers currently listed properties. Once properties are removed from the portal, they are soon removed from this tab.

How is the raw data processed?

Duplicates from multiple sources are matched and reconciled as far as possible. Listings with obvious errors, where price or number or bedrooms appear out of range, are discarded.

What are the statistics used?

The average shown is the interquartile mean, a type of average that is insensitive to outliers while being its own distinct parameter. The 80% range means that 80% of the listed properties fall inside this range.

Where does the raw data come from?

Room let listings on SpareRoom, the UK's biggest room letting website.

How often is the data updated?

The data is updated in near real-time.

What time period does the data cover?

This is a real-time market snapshot - the data covers currently listed properties. Once properties are removed from SpareRoom, they are soon removed from this tab.

How is the raw data processed?

Listings with obvious errors, where price or number or bedrooms appear out of range, are discarded.

What are the statistics used?

The average shown is the interquartile mean, a type of average that is insensitive to outliers while being its own distinct parameter. The 80% range means that 80% of the listed properties fall inside this range.

Where does the raw data come from?

Property listings seen on rightmove.co.uk, zoopla.co.uk and onthemarket.com.

How often is the data updated?

The data is updated in near real-time.

What time period does the data cover?

This is a real-time market snapshot - the data covers currently listed properties. Once properties are removed from the portal, they are soon removed from this tab.

How is the raw data processed?

Duplicates from multiple sources are matched and reconciled as far as possible. Listings with obvious errors, where price or number or bedrooms appear out of range, are discarded. Yields are calculated by comparing only properties with the same number of bedrooms, e.g. 3-bedroom properties for rent with 3-bedroom properties for sale.

What is the yield calculation used?

The calculation used is (average_weekly_asking_rent * 52 / average_asking_price), expressed as a percentage. It is a top-line gross yield, meaning no expenses are considered.

What are the statistics used?

The average shown is the interquartile mean, a type of average that is insensitive to outliers while being its own distinct parameter. The 80% range means that 80% of the listed properties fall inside this range.

Where does the raw data come from?

Property listings seen on rightmove.co.uk, zoopla.co.uk and onthemarket.com.

How often is the data updated?

The data is updated in near real-time.

What time period does the data cover?

This is a real-time market snapshot - the data covers currently listed properties. Once properties are removed from Zoopla, Rightmove or Spareroom, they are soon removed from this tab.

How is the raw data processed?

Duplicates from multiple sources are matched and reconciled as far as possible. Yields are calculated by comparing only properties with the same number of bedrooms, e.g. 3-bedroom properties for rent with 3-bedroom properties for sale. For the SpareRoom data, hypothetical properties consisting of two to six average double rooms with shared bathrooms are used to derived average rent. For all sources, listings with obvious errors, where price or number or bedrooms appear out of range, are discarded.

What is the yield calculation used?

The calculation used is (average_weekly_asking_rent * 52 / average_asking_price), expressed as a percentage. It is a top-line gross yield, meaning no expenses are considered.

What are the statistics used?

The average shown is the interquartile mean, a type of average that is insensitive to outliers while being its own distinct parameter. The 80% range means that 80% of the listed properties fall inside this range.

Where does the raw data come from?

Property "price paid" data provided by the Land Registry.

How often is the data updated?

Once per month when released by the Land Registry, typically towards the end of each calendar month covering up to the end of the previous calendar month.

Zoopla Zed-index

What time period does the data cover?

The data covers transactions in the last six years

How is the raw data processed?

No additional processes are applied to this data.

What are the statistics used?

The average shown is the interquartile mean, a type of average that is insensitive to outliers while being its own distinct parameter. The 80% range means that 80% of the listed properties fall inside this range.

Where does the raw data come from?

Property listings seen on rightmove.co.uk, zoopla.co.uk and onthemarket.com.

How often is the data updated?

The listings data is updated in near real-time. The Land Registry data is updated once per month when released, typically towards the end of each calendar month covering up to the end of the previous calendar month.

What time period does the data cover?

The price paid data shown goes back to January 2015. The listings data is a real-time market snapshot - the data covers currently listed properties. Once properties are removed from the portal, they are soon removed from this tab.

How is the raw data processed?

Duplicates from multiple sources are matched and reconciled as far as possible. Listings with obvious errors, where price or number or bedrooms appear out of range, are discarded.

What are the calculations used?

Average sales per month are for the last 3 finalised months. Turnover is average sales per month divided by total for sale. Inventory is 100 divided by turnover.

Where does the raw data come from?

Property listings seen on rightmove.co.uk, zoopla.co.uk and onthemarket.com.

How often is the data updated?

The listings data is updated in near real-time. The Land Registry data is updated once per month when released, typically towards the end of each calendar month covering up to the end of the previous calendar month.

What time period does the data cover?

This is a real-time market snapshot - the data covers currently listed properties. Once properties are removed from the portal, they are soon removed from this tab.

How is the raw data processed?

Duplicates from multiple sources are matched and reconciled as far as possible. Listings with obvious errors, where price or number or bedrooms appear out of range, are discarded.

Where does the raw data come from?

We receive data on the extent and corporate ownership of all land titles in England & Wales from the Land Registry.

How often is the data updated?

The data is updated once per month when released, typically in the first few days of each calendar month.

What time period does the data cover?

This is an ownership snapshot - the data represents ownership as recorded by the Land Registry at the last monthly export.

How is the raw data processed?

No additional processes are applied to this data.

Where does the raw data come from?

We source different expert forecasts Savills, Knight Frank, OBR

How often is the data updated?

The data is updated annually when new forecasts are released, typically towards the beginning of the year.

How is the raw data processed?

We calculate a consensus forecast using a simple mean average.