How HS2 is set to heighten Manchester property development

Manchester is on the cusp of a new era of regeneration. HS2 - the UK’s new high-speed rail network - has recently acquired a second location within the centre of the city, and the announcement is expected to drive Manchester property investment.

The second site - at Travis Street’s Square One - is located close to Manchester Piccadilly train station, and has been purchased by the Department for Transport for an undisclosed fee. A spokesperson has stated that the site is “pivotal” for the success of the HS2 project.

Manchester has already witnessed growth as a result of previous HS2 announcements, with stops at Piccadilly and Manchester Airport having previously been confirmed. Several developers have announced regeneration plans in the vicinity of Piccadilly, with construction already underway on an all-purpose “Piccadilly neighbourhood”.

What is the purpose of HS2?

HS2 is a new rapid-speed rail network which connects London to the North. Trains will link Glasgow, Edinburgh, Manchester and Birmingham with the capital. The project is part of the government’s pledge to “level up”, with the purpose of connecting the largest economies in the country. As a result, businesses are being encouraged to concentrate outside of London and establish themselves in the North and the Midlands.

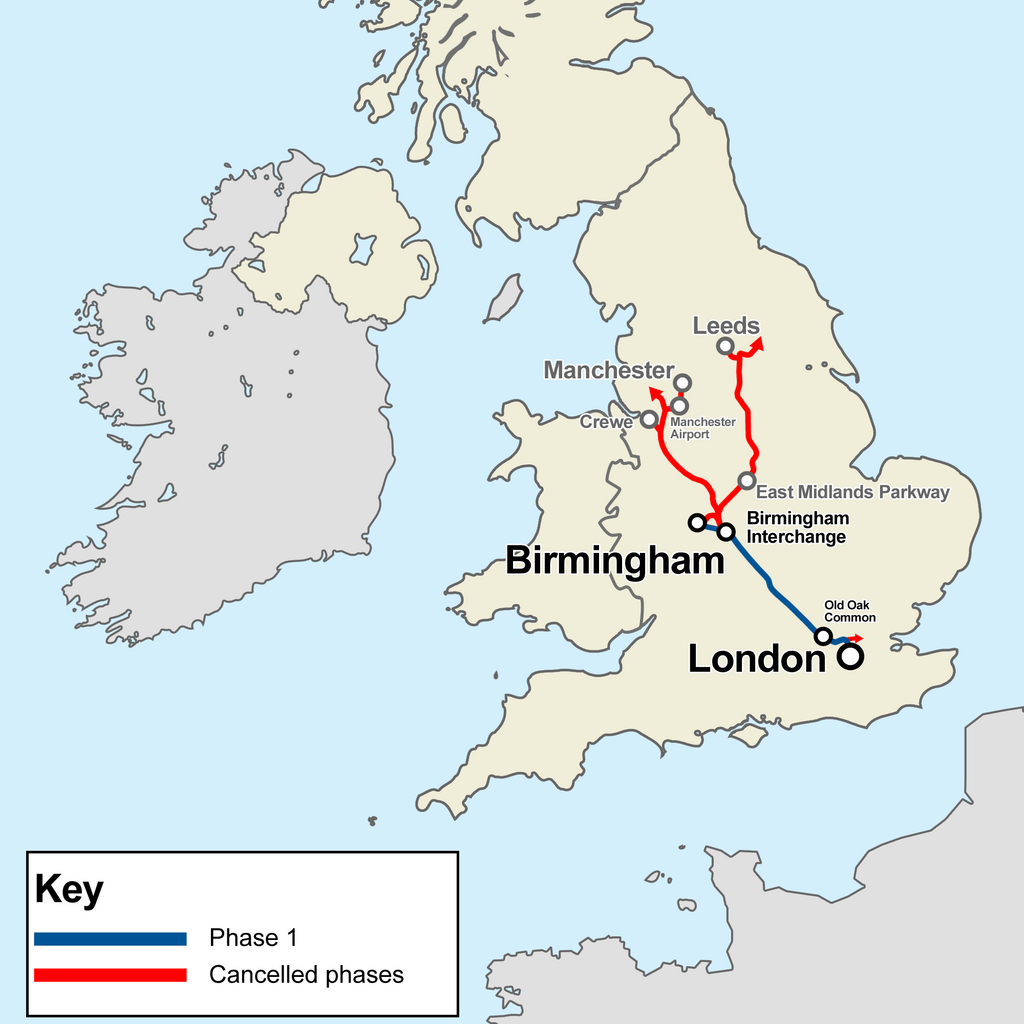
While the current rail infrastructure provides an important corridor throughout the heart of the country, it simply isn’t sufficient to meet the demands of modern UK businesses. The West Coast Main Line, for example, has its roots in the Victorian era and suffers from overcrowded and often unreliable services.

It is the view of both Westminster and commerce experts that substandard train services are holding back areas of the North and the UK economy as a whole. Having investigated all options, the government has concluded that the current rail network cannot be improved much further, and any interim upgrades would bring both long and short-term disruption. The solution is to deliver a brand-new rail line with the purpose of creating greater connectivity between regions and providing greater capacity on the national rail network.

How is HS2 impacting property investment in Manchester?

Since the turn of the millennium, Manchester has been considered a “second city” to London as far as property investment is concerned. Manchester property investment has been a safe bet for developers and buy-to-let landlords for a number of years, on account of low property prices, high capital appreciation, increased housing demand among tenants and strong rental yields.

The latest HS2 announcement is expected to drive development in the city even further, with investors seeking to hone in on Manchester property development. It’s not just local investors either - overseas developers are increasingly investing in UK property, and Manchester is set to see an influx of foreign interest.

Ruth Todd, the CCO at HS2, has stated that the acquisition of powers to both construct and operate a high-speed line between Manchester and Crewe represents a “major milestone” in bringing rapid connectivity to the North of the country. Todd added that the HS2 purchase of Square One had been a “vote of confidence for investors, locally and internationally”.

The development is one of the largest in the UK at present, with investment expected to create 13,000 new homes, over 800,000 square metres of commercial space and up to 40,000 new jobs. Once completed, the new Piccadilly neighbourhood will feature retail space, a public square, community areas, new streets and an improvement in pedestrian connections.

Is buying property in Manchester a good investment?

Property investment is one of the safest asset classes UK has to offer. Whether you’re investing in UK property as a buy-to-let landlord or utilising real estate investment trusts as a means to help your capital to grow, property is a safe bet.

However, choosing the right location to invest in is key. Areas with high housing demand, low house prices and strong rental yields are ideal for property investors - and Manchester offers the perfect combination of all three.

Figures from June 2021 have demonstrated that house prices in Manchester have increased by over 9% in just twelve months, with the average property in the city now being worth over £217,000 - a staggering £55,000 below-median UK prices. Huge demand for housing in the area has meant that Manchester has become one of the first-choice destinations for investors who are seeking to capitalise on high levels of capital appreciation and strong rental yields.

Is Manchester a good place to buy to let?

Over the past five years, several studies have concluded that Manchester is an incredibly strong choice for buy-to-let investors. The wider Manchester area as a whole is performing well, and the recent HS2 announcement is expected to boost prices, rental yields and demand for housing in the city centre.

Manchester is home to a huge university population and is also populated by tens of thousands of young professionals - two of the largest rental demographics. Recent regeneration announcements will further bolster demand for housing, and with comparatively low property prices the city should be on the shortlist for any savvy buy-to-let investor - particularly when rental yields are so strong.

Ultimately, Manchester property investment offers a steady income stream for buy-to-let landlords in conjunction with high capital appreciation. This makes it one of the best areas of the UK for property investors to focus their attention on.

Find out more about Manchester property investment

Whether you’re a newcomer to property investment or looking to expand your existing portfolio, why not sign up to PropertyData for a free two-week trial? As a member, you will gain access to a wealth of tools and resources which can guide you towards making more informed Manchester property investment decisions. With up-to-date property prices by postcode, a rental yield calculator and tips on what to look for in a buy-to-let property, you could be better positioned to make smarter investment choices.

Sign up to PropertyData for free

How PropertyData can help you

PropertyData investor illustration

Be a smarter property investor using data

Some of the ways property investors use PropertyData to boost their returns

I'm an investor
PropertyData data illustration

Make data-driven development decisions

How property developers can use market research in decision-making

I'm a developer
PropertyData clients illustration

Save time and impress your clients with data

How agents can use PropertyData to gain an edge on the competition

I'm an agent

Limit reached

Sorry, you've reached your monthly search limit.

Upgrade your account or purchase additional credits for more searches.

Upgrade Purchase credits

Upgrade to download PDFs

There are many places in PropertyData to export data as well-formatted PDF files, including Local Data, Plot Map, Valuations, property reports and more.

  Download PDFs Branded PDFs
Basic
Standard
Pro
Unlimited
Start your free trial now

Transparent data promise

Where does the raw data come from?

Property listings seen on rightmove.co.uk, zoopla.co.uk and onthemarket.com.

How often is the data updated?

The data is updated in near real-time.

What time period does the data cover?

This is a real-time market snapshot - the data covers currently listed properties. Once properties are removed from the portal, they are soon removed from this tab.

How is the raw data processed?

Duplicates from multiple sources are matched and reconciled as far as possible. Listings with obvious errors, where price or number or bedrooms appear out of range, are discarded.

What are the statistics used?

Averages shown are the interquartile mean, a type of average that is insensitive to outliers while being its own distinct parameter. The 80% range means that 80% of the listed properties fall inside this range.

Where does the raw data come from?

Property listings seen on rightmove.co.uk, zoopla.co.uk and onthemarket.com.

How do you know the square footage of properties?

We use proprietary technology to read the square footage of properties from agent floorplans. Although we cannot determine the square footage for all properties, we can usually get sufficient coverage. Agents are sometimes known to inflate square footage, and this should be borne in mind as a weakness of this data.

How often is the data updated?

The data is updated in near real-time.

What time period does the data cover?

This is a real-time market snapshot - the data covers currently listed properties. Once properties are removed from the portal, they are soon removed from this tab.

How is the raw data processed?

Duplicates from multiple sources are matched and reconciled as far as possible. Listings with obvious errors, where price or number or bedrooms appear out of range, are discarded.

What are the statistics used?

The average shown is the interquartile mean, a type of average that is insensitive to outliers while being its own distinct parameter. The 80% range means that 80% of the listed properties fall inside this range.

Where does the raw data come from?

Property "price paid" data provided by the Land Registry.

How often is the data updated?

Once per month when released by the Land Registry, typically towards the end of each calendar month covering up to the end of the previous calendar month.

What time period does the data cover?

You can customise the time period using the filter at the top of the view. The default time period is up to 9 months back from today's date. The latest data covers the period up to 2024-03-28, although some sales that took place before this date may still be added in the coming months.

How is the raw data processed?

No additional processes are applied to this data.

What are the statistics used?

Averages shown are the interquartile mean, a type of average that is insensitive to outliers while being its own distinct parameter. The 80% range means that 80% of the listed properties fall inside this range.

Where does the raw data come from?

Property "price paid" data provided by the Land Registry, and Energy Performance Certificate (EPC) data provided by Department for Levelling Up, Housing & Communities.

How do you know the square footage of properties?

We match the Land Registry data to EPC data provided by the Department for Levelling Up, Housing & Communities. Due to the fact that not all properties sold have had an EPC and vagaries of addressing in the UK, we are not able to determine the square footage of all properties, but we can usually get sufficient coverage.

How often is the data updated?

The private paid data is updated once per month when released by the Land Registry, typically towards the end of each calendar month covering up to the end of the previous calendar month. The energy performance certificate database is updated monthly.

What time period does the data cover?

You can customise the time period using the filter at the top of the view. The default time period is up to 9 months back from today's date. The latest data covers the period up to 2024-03-28, although some sales that took place before this date may still be added in the coming months.

How is the raw data processed?

No additional processes are applied to this data.

What are the statistics used?

The average shown is the interquartile mean, a type of average that is insensitive to outliers while being its own distinct parameter. The 80% range means that 80% of the listed properties fall inside this range.

Where does the raw data come from?

Property listings seen on rightmove.co.uk, zoopla.co.uk and onthemarket.com.

How often is the data updated?

The data is updated in near real-time.

What time period does the data cover?

This is a real-time market snapshot - the data covers currently listed properties. Once properties are removed from the portal, they are soon removed from this tab.

How is the raw data processed?

Duplicates from multiple sources are matched and reconciled as far as possible. Listings with obvious errors, where price or number or bedrooms appear out of range, are discarded.

What are the statistics used?

The average shown is the interquartile mean, a type of average that is insensitive to outliers while being its own distinct parameter. The 80% range means that 80% of the listed properties fall inside this range.

Where does the raw data come from?

Room let listings on SpareRoom, the UK's biggest room letting website.

How often is the data updated?

The data is updated in near real-time.

What time period does the data cover?

This is a real-time market snapshot - the data covers currently listed properties. Once properties are removed from SpareRoom, they are soon removed from this tab.

How is the raw data processed?

Listings with obvious errors, where price or number or bedrooms appear out of range, are discarded.

What are the statistics used?

The average shown is the interquartile mean, a type of average that is insensitive to outliers while being its own distinct parameter. The 80% range means that 80% of the listed properties fall inside this range.

Where does the raw data come from?

Property listings seen on rightmove.co.uk, zoopla.co.uk and onthemarket.com.

How often is the data updated?

The data is updated in near real-time.

What time period does the data cover?

This is a real-time market snapshot - the data covers currently listed properties. Once properties are removed from the portal, they are soon removed from this tab.

How is the raw data processed?

Duplicates from multiple sources are matched and reconciled as far as possible. Listings with obvious errors, where price or number or bedrooms appear out of range, are discarded. Yields are calculated by comparing only properties with the same number of bedrooms, e.g. 3-bedroom properties for rent with 3-bedroom properties for sale.

What is the yield calculation used?

The calculation used is (average_weekly_asking_rent * 52 / average_asking_price), expressed as a percentage. It is a top-line gross yield, meaning no expenses are considered.

What are the statistics used?

The average shown is the interquartile mean, a type of average that is insensitive to outliers while being its own distinct parameter. The 80% range means that 80% of the listed properties fall inside this range.

Where does the raw data come from?

Property listings seen on rightmove.co.uk, zoopla.co.uk and onthemarket.com.

How often is the data updated?

The data is updated in near real-time.

What time period does the data cover?

This is a real-time market snapshot - the data covers currently listed properties. Once properties are removed from Zoopla, Rightmove or Spareroom, they are soon removed from this tab.

How is the raw data processed?

Duplicates from multiple sources are matched and reconciled as far as possible. Yields are calculated by comparing only properties with the same number of bedrooms, e.g. 3-bedroom properties for rent with 3-bedroom properties for sale. For the SpareRoom data, hypothetical properties consisting of two to six average double rooms with shared bathrooms are used to derived average rent. For all sources, listings with obvious errors, where price or number or bedrooms appear out of range, are discarded.

What is the yield calculation used?

The calculation used is (average_weekly_asking_rent * 52 / average_asking_price), expressed as a percentage. It is a top-line gross yield, meaning no expenses are considered.

What are the statistics used?

The average shown is the interquartile mean, a type of average that is insensitive to outliers while being its own distinct parameter. The 80% range means that 80% of the listed properties fall inside this range.

Where does the raw data come from?

Property "price paid" data provided by the Land Registry.

How often is the data updated?

Once per month when released by the Land Registry, typically towards the end of each calendar month covering up to the end of the previous calendar month.

Zoopla Zed-index

What time period does the data cover?

The data covers transactions in the last six years

How is the raw data processed?

No additional processes are applied to this data.

What are the statistics used?

The average shown is the interquartile mean, a type of average that is insensitive to outliers while being its own distinct parameter. The 80% range means that 80% of the listed properties fall inside this range.

Where does the raw data come from?

Property listings seen on rightmove.co.uk, zoopla.co.uk and onthemarket.com.

How often is the data updated?

The listings data is updated in near real-time. The Land Registry data is updated once per month when released, typically towards the end of each calendar month covering up to the end of the previous calendar month.

What time period does the data cover?

The price paid data shown goes back to January 2015. The listings data is a real-time market snapshot - the data covers currently listed properties. Once properties are removed from the portal, they are soon removed from this tab.

How is the raw data processed?

Duplicates from multiple sources are matched and reconciled as far as possible. Listings with obvious errors, where price or number or bedrooms appear out of range, are discarded.

What are the calculations used?

Average sales per month are for the last 3 finalised months. Turnover is average sales per month divided by total for sale. Inventory is 100 divided by turnover.

Where does the raw data come from?

Property listings seen on rightmove.co.uk, zoopla.co.uk and onthemarket.com.

How often is the data updated?

The listings data is updated in near real-time. The Land Registry data is updated once per month when released, typically towards the end of each calendar month covering up to the end of the previous calendar month.

What time period does the data cover?

This is a real-time market snapshot - the data covers currently listed properties. Once properties are removed from the portal, they are soon removed from this tab.

How is the raw data processed?

Duplicates from multiple sources are matched and reconciled as far as possible. Listings with obvious errors, where price or number or bedrooms appear out of range, are discarded.

Where does the raw data come from?

We receive data on the extent and corporate ownership of all land titles in England & Wales from the Land Registry.

How often is the data updated?

The data is updated once per month when released, typically in the first few days of each calendar month.

What time period does the data cover?

This is an ownership snapshot - the data represents ownership as recorded by the Land Registry at the last monthly export.

How is the raw data processed?

No additional processes are applied to this data.

Where does the raw data come from?

We source different expert forecasts Savills, Knight Frank, OBR

How often is the data updated?

The data is updated annually when new forecasts are released, typically towards the beginning of the year.

How is the raw data processed?

We calculate a consensus forecast using a simple mean average.